Open Access
Fig. 6
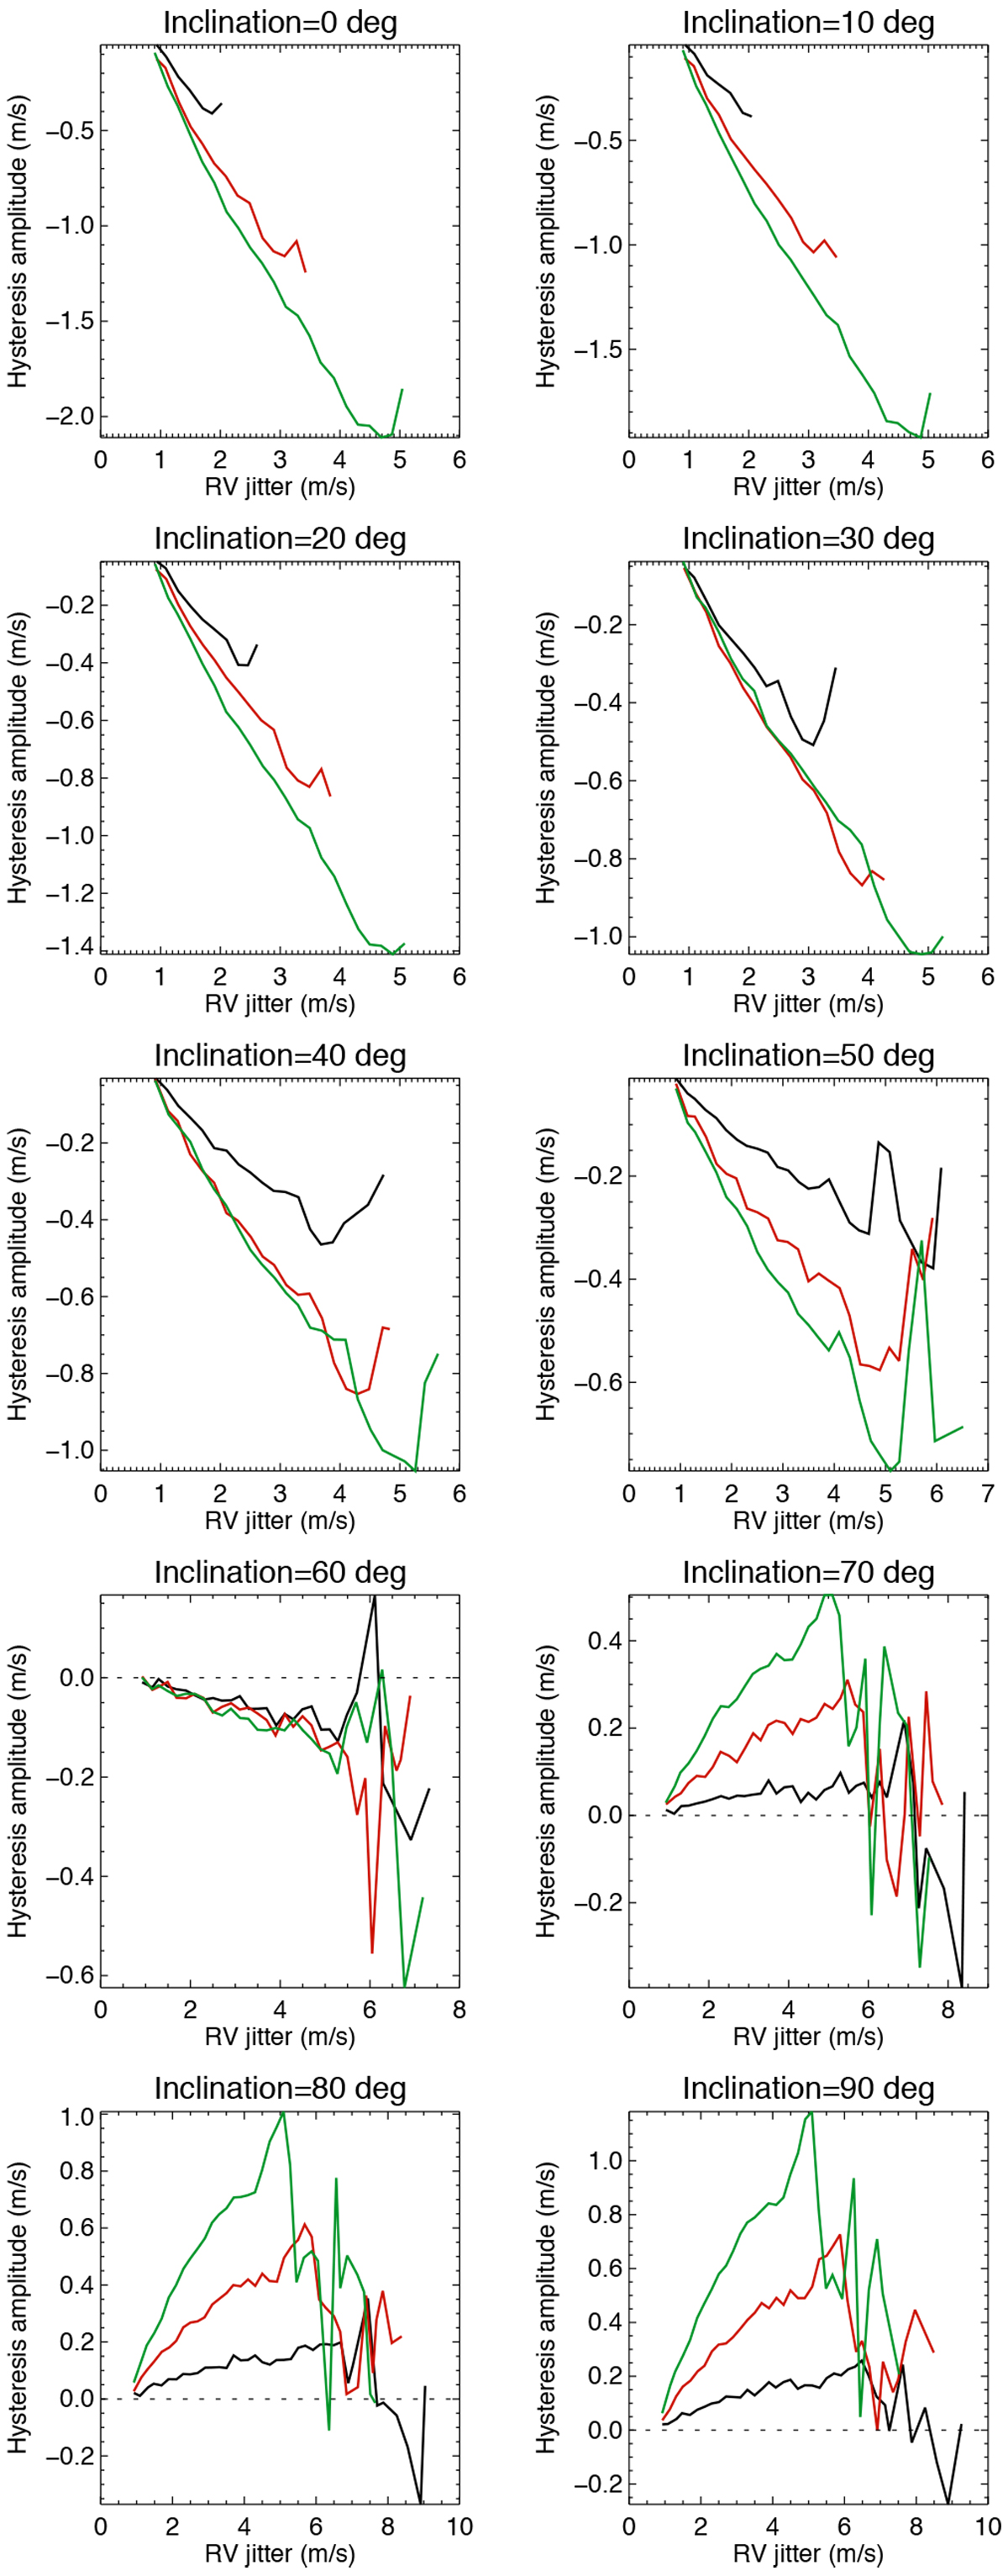
Average hysteresis vs. RV jitter for three values of θmax: solar (black), solar +10° (red), and solar +20° (green). Each plot corresponds to a different inclination, from pole-on (0°, upper left panel) to edge-on (90°, lower right panel). All plots are on the same scale in m s−1.
Current usage metrics show cumulative count of Article Views (full-text article views including HTML views, PDF and ePub downloads, according to the available data) and Abstracts Views on Vision4Press platform.
Data correspond to usage on the plateform after 2015. The current usage metrics is available 48-96 hours after online publication and is updated daily on week days.
Initial download of the metrics may take a while.