Open Access
Fig. 4
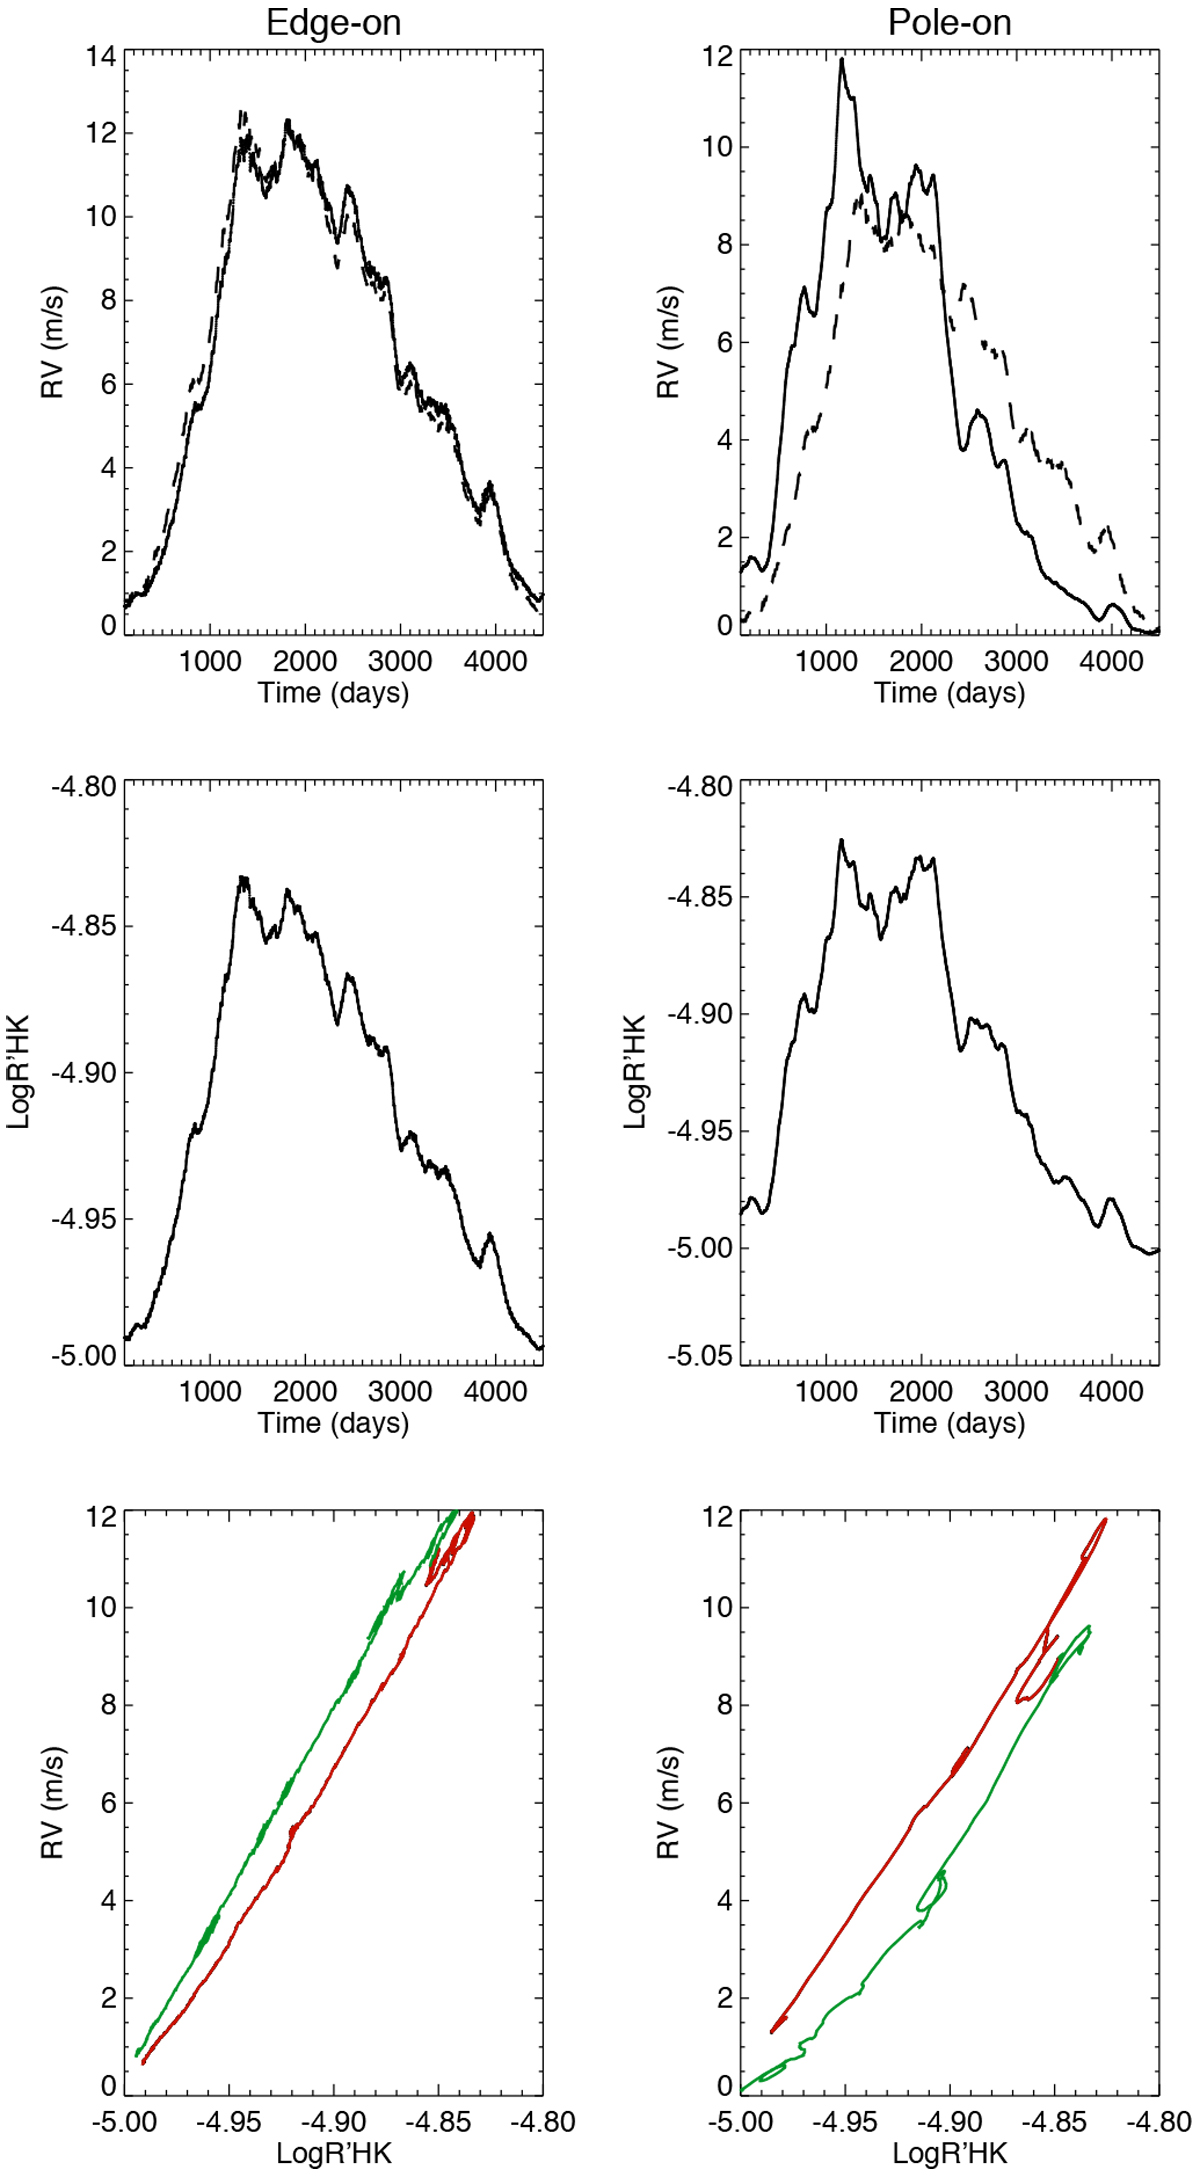
Example of smoothed time series for a moderately active G2 star seen edge-on (left) and pole-on (right). First line: RV vs. time (solid line), and RV fitted from the
![]() variations (dashed line). Second line:
variations (dashed line). Second line: ![]() vs. time. Third line: RV vs.
vs. time. Third line: RV vs. ![]() , during the ascending phase of the cycle (red) and during the descending phase (green).
, during the ascending phase of the cycle (red) and during the descending phase (green).
Current usage metrics show cumulative count of Article Views (full-text article views including HTML views, PDF and ePub downloads, according to the available data) and Abstracts Views on Vision4Press platform.
Data correspond to usage on the plateform after 2015. The current usage metrics is available 48-96 hours after online publication and is updated daily on week days.
Initial download of the metrics may take a while.