Fig. 2
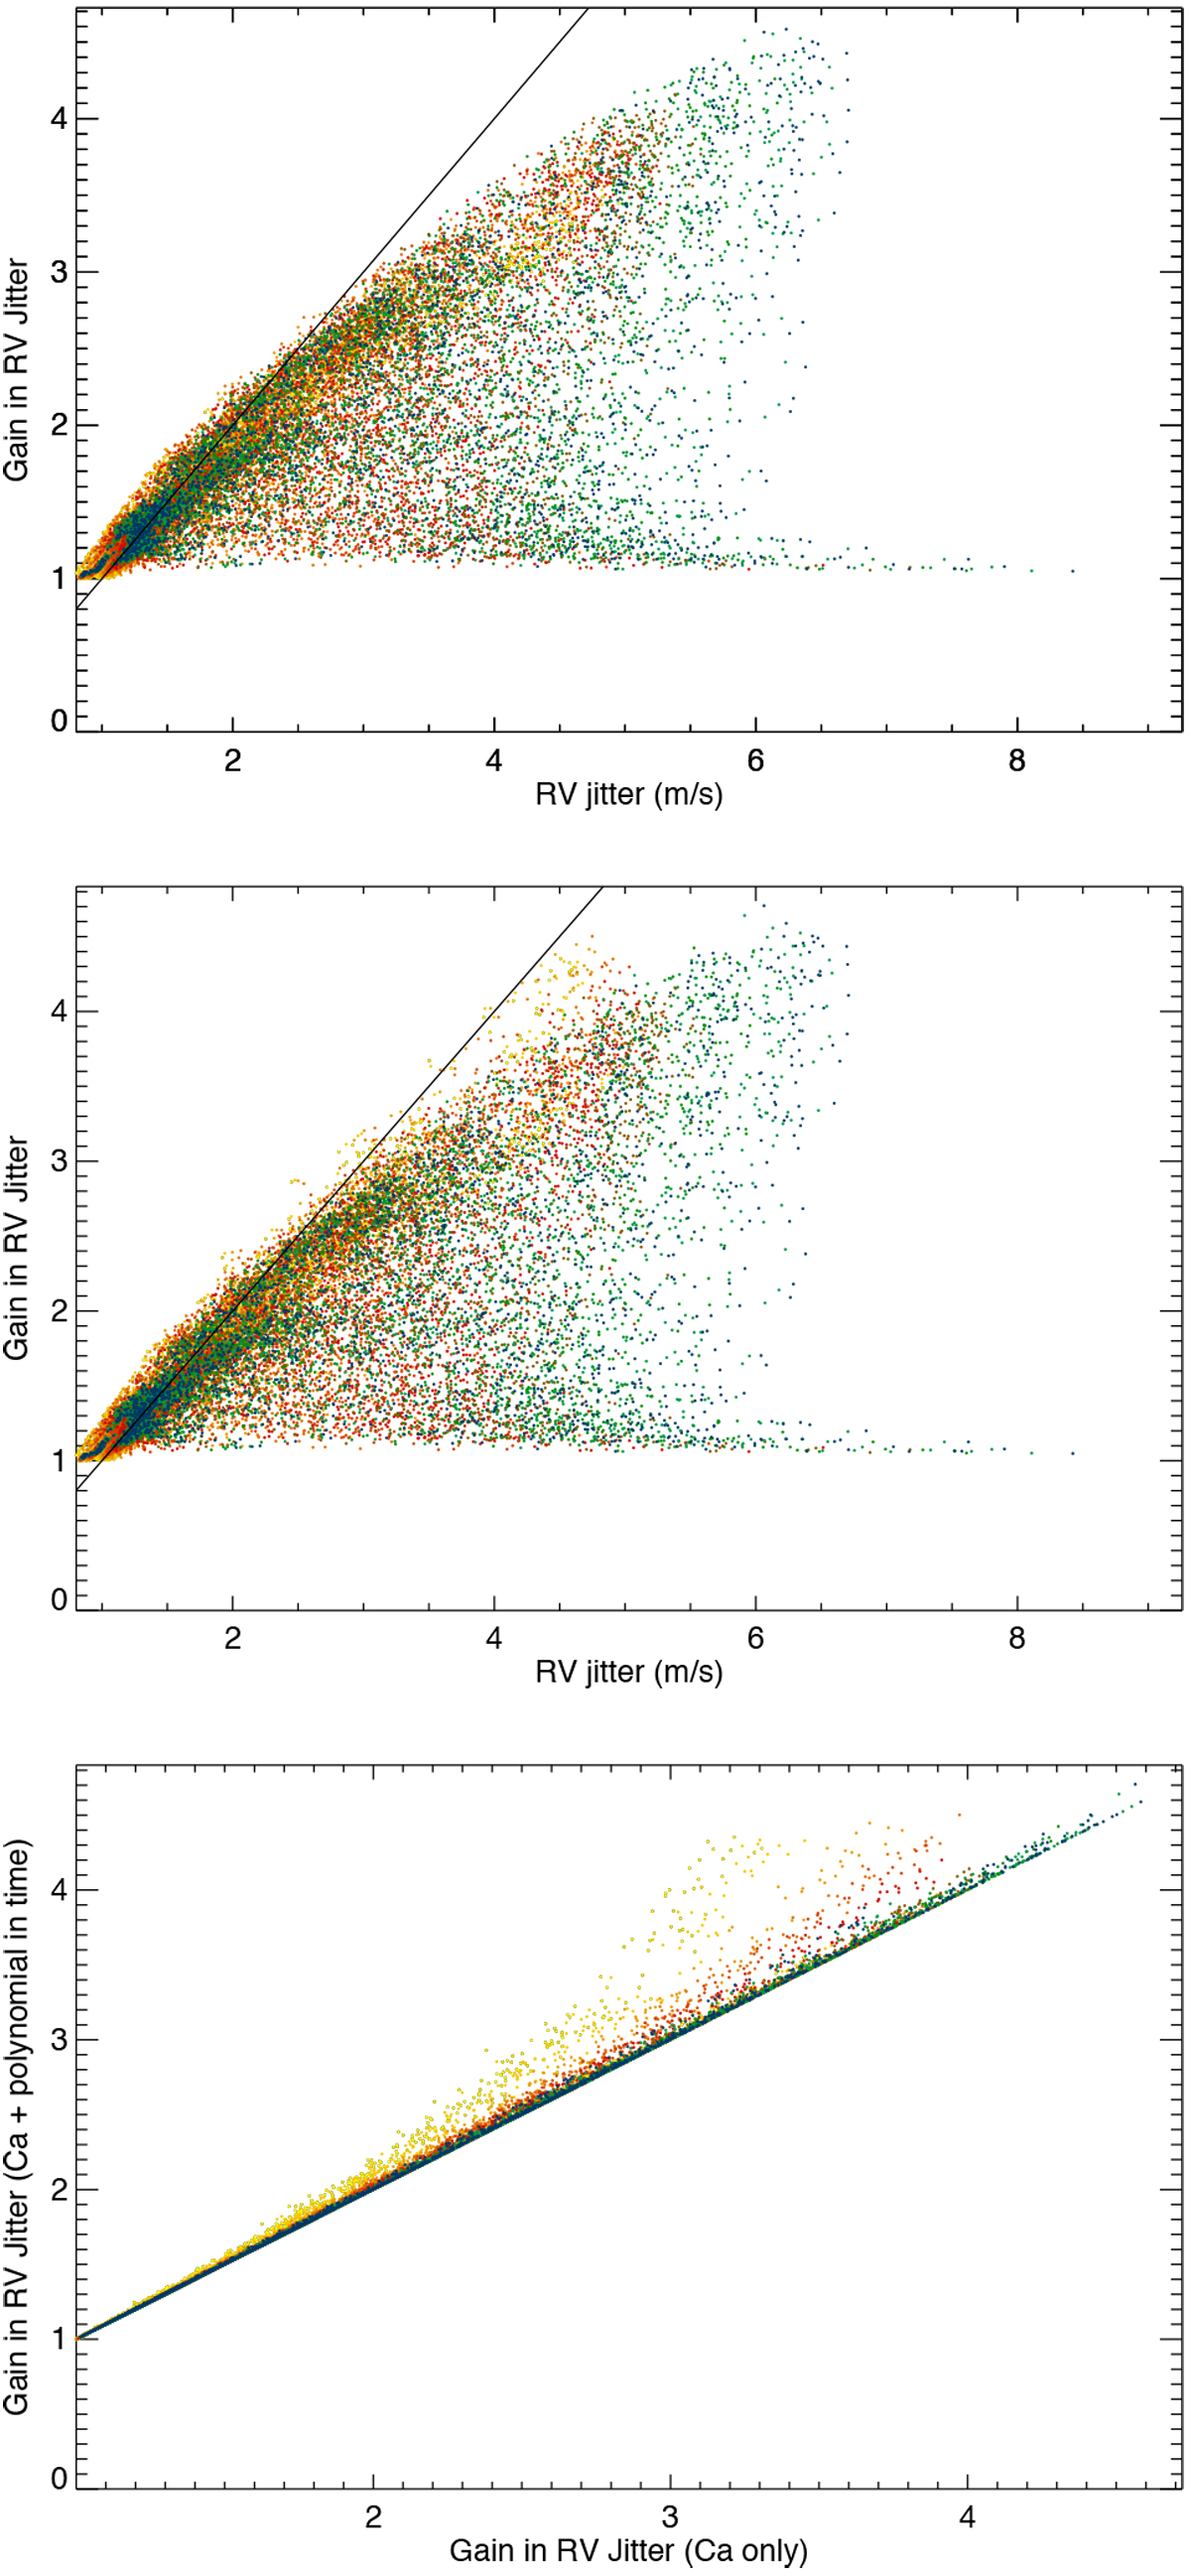
Gain in RV jitter in various conditions. Upper panel: gain vs. RV jitter (for simulations including rvogs and rvinst, and for ΔTspot2), for a correction with ![]() alone. The straight black line has a slope of 1, indicating points where the correction allows a residual RV jitter of 1 m s−1 to be reached. The colour code corresponds to inclination, from pole-on (i = 0°, yellow) to edge-on (i = 90°, blue), with light and dark orange corresponding to 20°
and 30°, light and dark red to 40°
and 50°, brown to 60°, and light and dark green to 70°
and 80°.
Middle panel: same for a correction with
alone. The straight black line has a slope of 1, indicating points where the correction allows a residual RV jitter of 1 m s−1 to be reached. The colour code corresponds to inclination, from pole-on (i = 0°, yellow) to edge-on (i = 90°, blue), with light and dark orange corresponding to 20°
and 30°, light and dark red to 40°
and 50°, brown to 60°, and light and dark green to 70°
and 80°.
Middle panel: same for a correction with ![]() and a second-degree polynomial in time. Lower panel: gain with
and a second-degree polynomial in time. Lower panel: gain with ![]() and time correction vs. gain with
and time correction vs. gain with ![]() correction only. Only one point out of five is shown for clarity.
correction only. Only one point out of five is shown for clarity.
Current usage metrics show cumulative count of Article Views (full-text article views including HTML views, PDF and ePub downloads, according to the available data) and Abstracts Views on Vision4Press platform.
Data correspond to usage on the plateform after 2015. The current usage metrics is available 48-96 hours after online publication and is updated daily on week days.
Initial download of the metrics may take a while.