Open Access
Fig. A.6
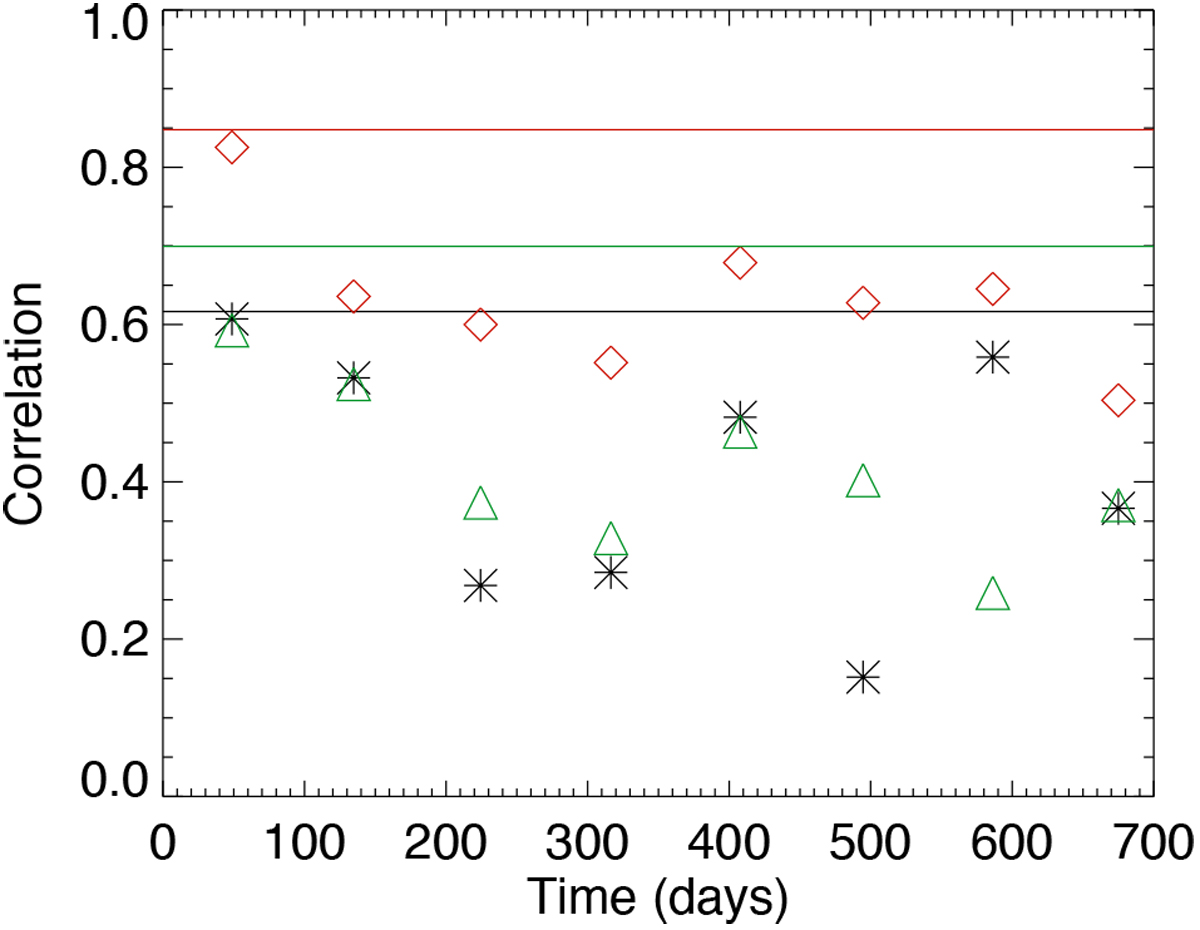
Local correlation between RV and ![]() vs. time (Julian days – 2 457 222.5) for RV observed with HARPS (black stars), and reconstruted from HMI (raw in red diamonds, with noise added in green triangles), estimated from time series published by Milbourne et al. (2019). The horizontal lines correspond to the global correlations.
vs. time (Julian days – 2 457 222.5) for RV observed with HARPS (black stars), and reconstruted from HMI (raw in red diamonds, with noise added in green triangles), estimated from time series published by Milbourne et al. (2019). The horizontal lines correspond to the global correlations.
Current usage metrics show cumulative count of Article Views (full-text article views including HTML views, PDF and ePub downloads, according to the available data) and Abstracts Views on Vision4Press platform.
Data correspond to usage on the plateform after 2015. The current usage metrics is available 48-96 hours after online publication and is updated daily on week days.
Initial download of the metrics may take a while.