Open Access
Fig. A.5
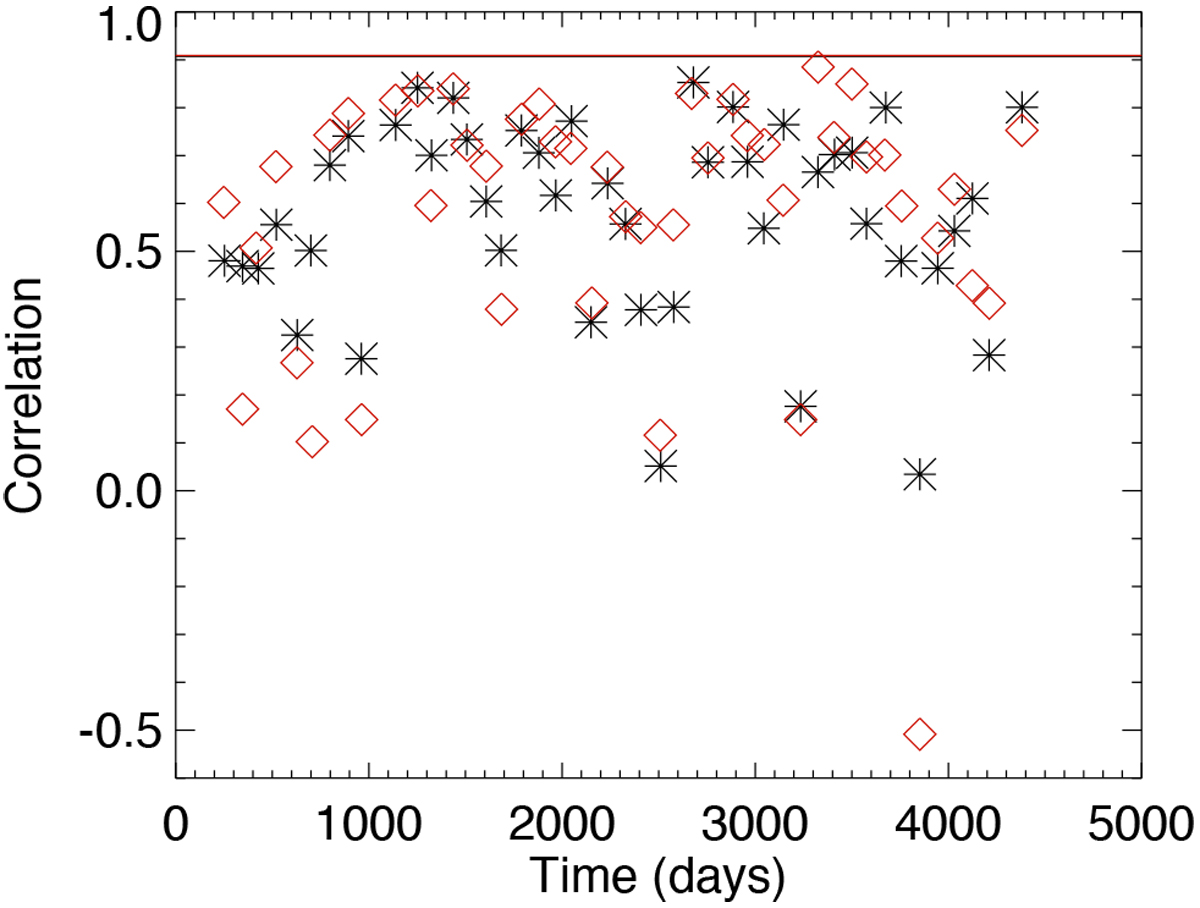
Local correlation between RV and ![]() vs. time (Julian days - 2 450 000) for RV reconstructed from observed solar structures (Meunier et al. 2010a) in black (stars) and from RV estimated from MDI/SOHO Dopplergrams (Meunier et al. 2010b) in red (diamonds). The horizontal lines correspond to the global correlations.
vs. time (Julian days - 2 450 000) for RV reconstructed from observed solar structures (Meunier et al. 2010a) in black (stars) and from RV estimated from MDI/SOHO Dopplergrams (Meunier et al. 2010b) in red (diamonds). The horizontal lines correspond to the global correlations.
Current usage metrics show cumulative count of Article Views (full-text article views including HTML views, PDF and ePub downloads, according to the available data) and Abstracts Views on Vision4Press platform.
Data correspond to usage on the plateform after 2015. The current usage metrics is available 48-96 hours after online publication and is updated daily on week days.
Initial download of the metrics may take a while.