Fig. A.4
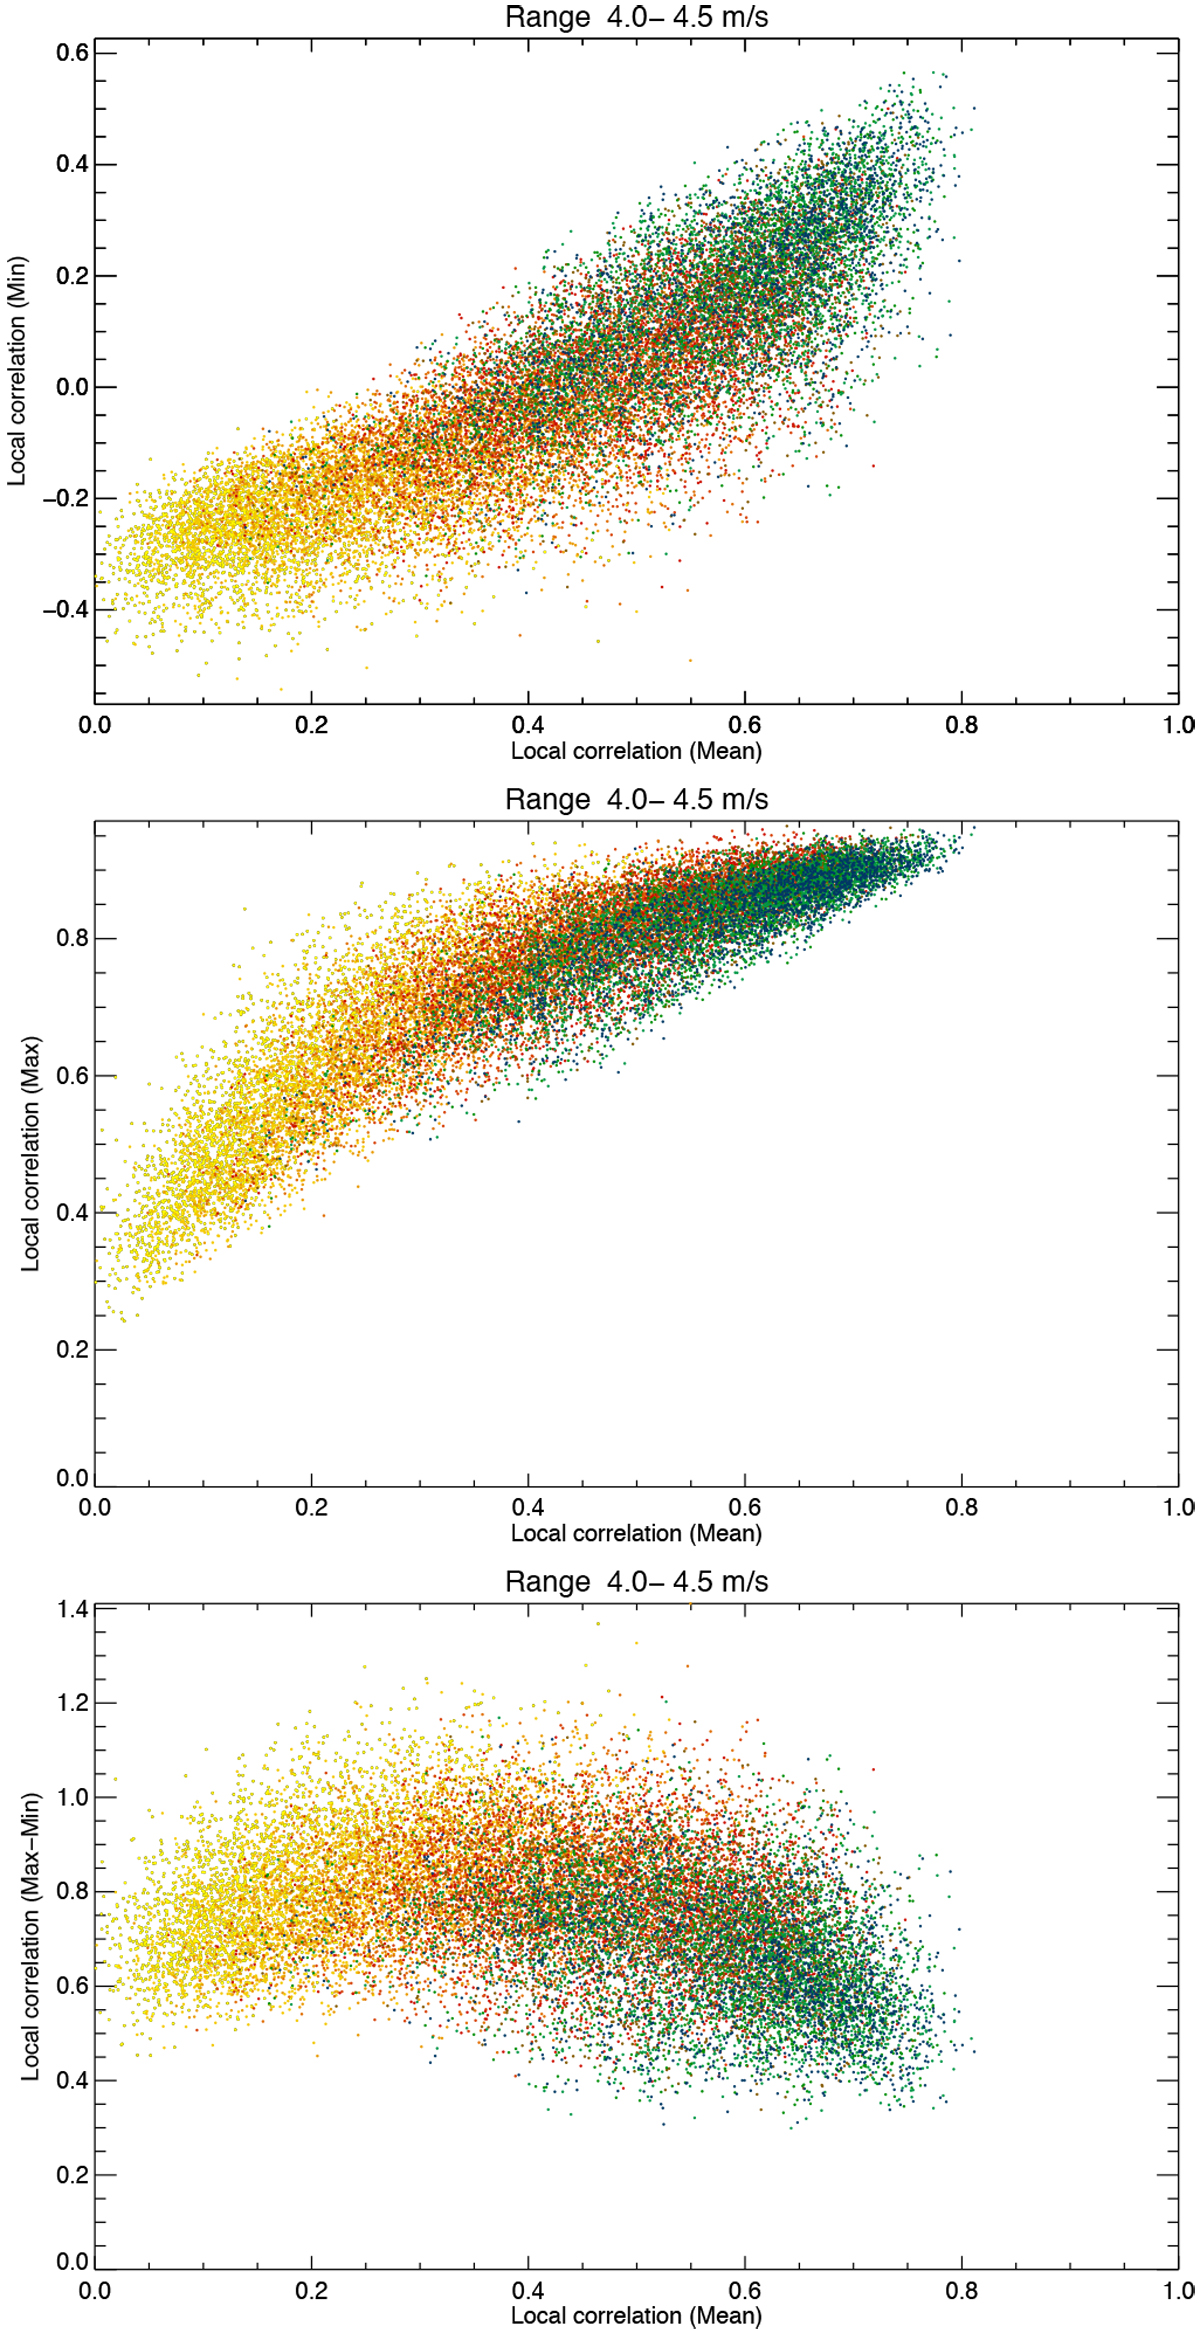
Upper panel: minimum value of short-term correlation (including activity, rvogs and rvinst). The minimum is computed over the N values of a given time series (see text). The colour code is similar to Fig. 2. Upper panel: same for the maximum of the short-term correlations. Lower panel: same for the maximum minus minimum of the short-term correlation. Only one point out of five is shown for clarity.
Current usage metrics show cumulative count of Article Views (full-text article views including HTML views, PDF and ePub downloads, according to the available data) and Abstracts Views on Vision4Press platform.
Data correspond to usage on the plateform after 2015. The current usage metrics is available 48-96 hours after online publication and is updated daily on week days.
Initial download of the metrics may take a while.