Fig. 11
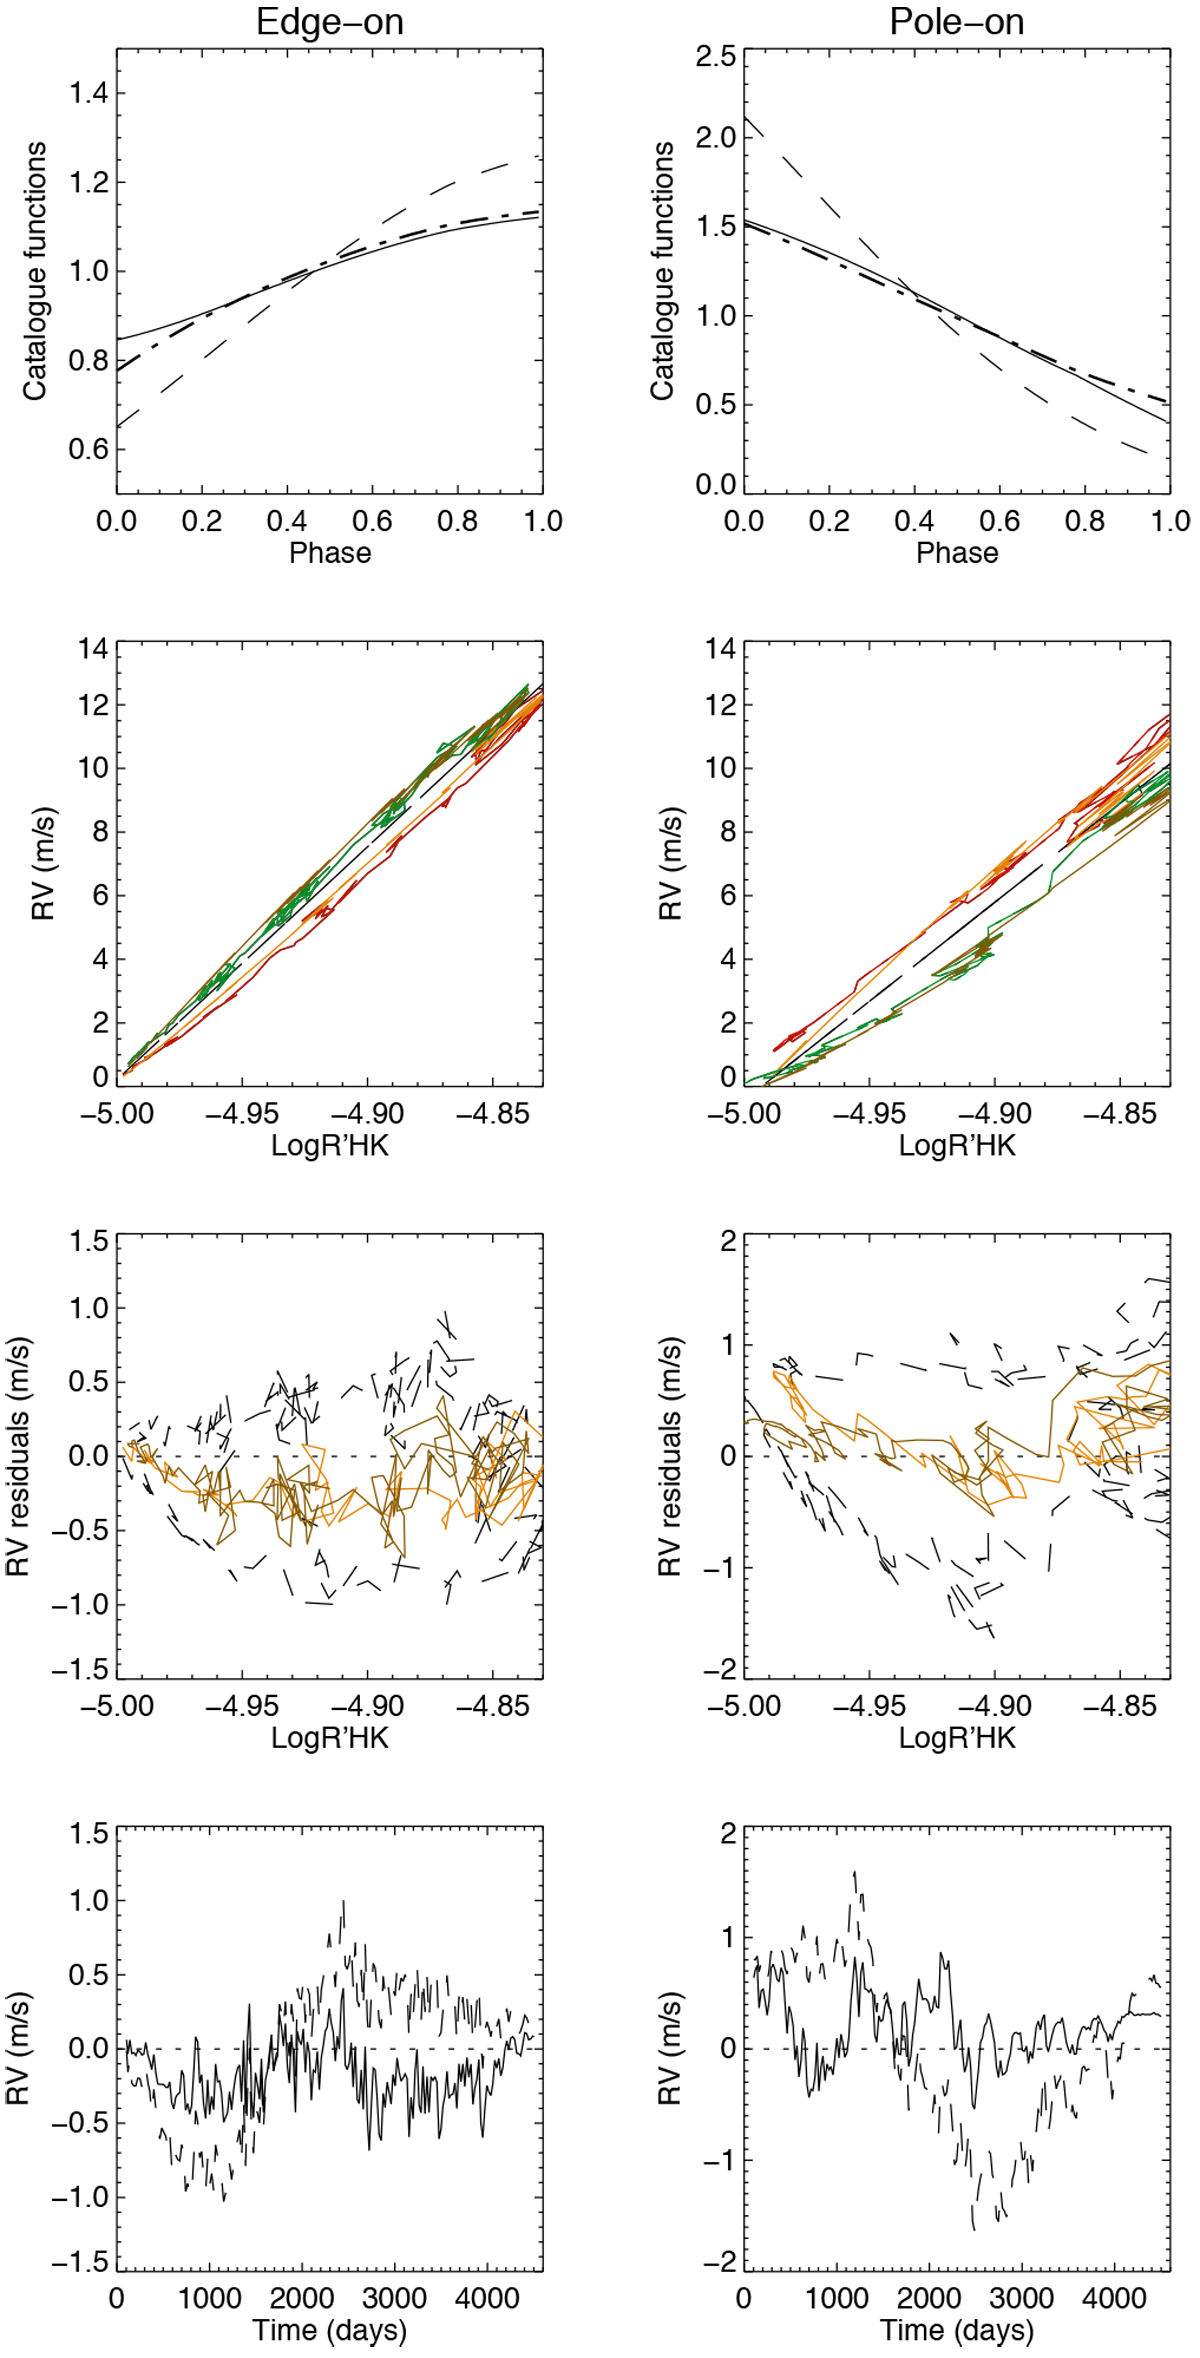
First panel: example of correcting function from catalogue (see Sect. 6.4) vs. phase for edge-on configuration (left) and pole-on configuration (right): chromospheric emission (solid line), RV (dashed line), and ratio between RV and chromospheric (thick dotted-dashed line), all normalized to 1 for clarity. Second panel: RV vs. chromospheric emission for the simulation shown in Fig. 4, colour-coded according to the cycle phase: red for the ascending phase, green for the descending phase. The orange and brown curves correspond to the same phases respectively but for the model derived from the catalogue functions. The black dashed line is the linear fit between RV and
![]() .
Third panel: RV residual after standard correction (black dashed line) and after the new correction (orange and brown solid lines as in the second panel). Fourth panel: RV residual vs. time after standard correction (dashed line) and after the new correction (solid line).
.
Third panel: RV residual after standard correction (black dashed line) and after the new correction (orange and brown solid lines as in the second panel). Fourth panel: RV residual vs. time after standard correction (dashed line) and after the new correction (solid line).
Current usage metrics show cumulative count of Article Views (full-text article views including HTML views, PDF and ePub downloads, according to the available data) and Abstracts Views on Vision4Press platform.
Data correspond to usage on the plateform after 2015. The current usage metrics is available 48-96 hours after online publication and is updated daily on week days.
Initial download of the metrics may take a while.