Fig. 8.
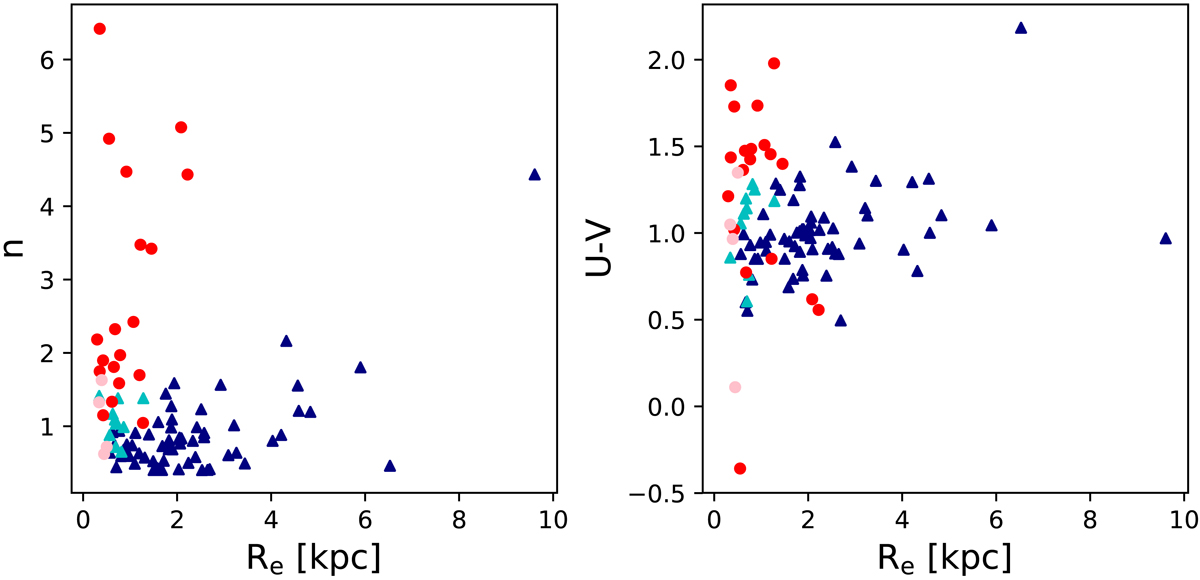
Classification of galaxies based on effective radius, Sérsic index, and U − V color into classes A and B (see text). Red and blue dots are galaxies belonging to class A and B with probability p > 0.8, respectively. Pink and cyan dots are galaxies that belong to class A and B with 0.8 ≥ p > 0.5, respectively. The parameters used in this plot are the median values for each galaxy across all bands.
Current usage metrics show cumulative count of Article Views (full-text article views including HTML views, PDF and ePub downloads, according to the available data) and Abstracts Views on Vision4Press platform.
Data correspond to usage on the plateform after 2015. The current usage metrics is available 48-96 hours after online publication and is updated daily on week days.
Initial download of the metrics may take a while.