Fig. 7.
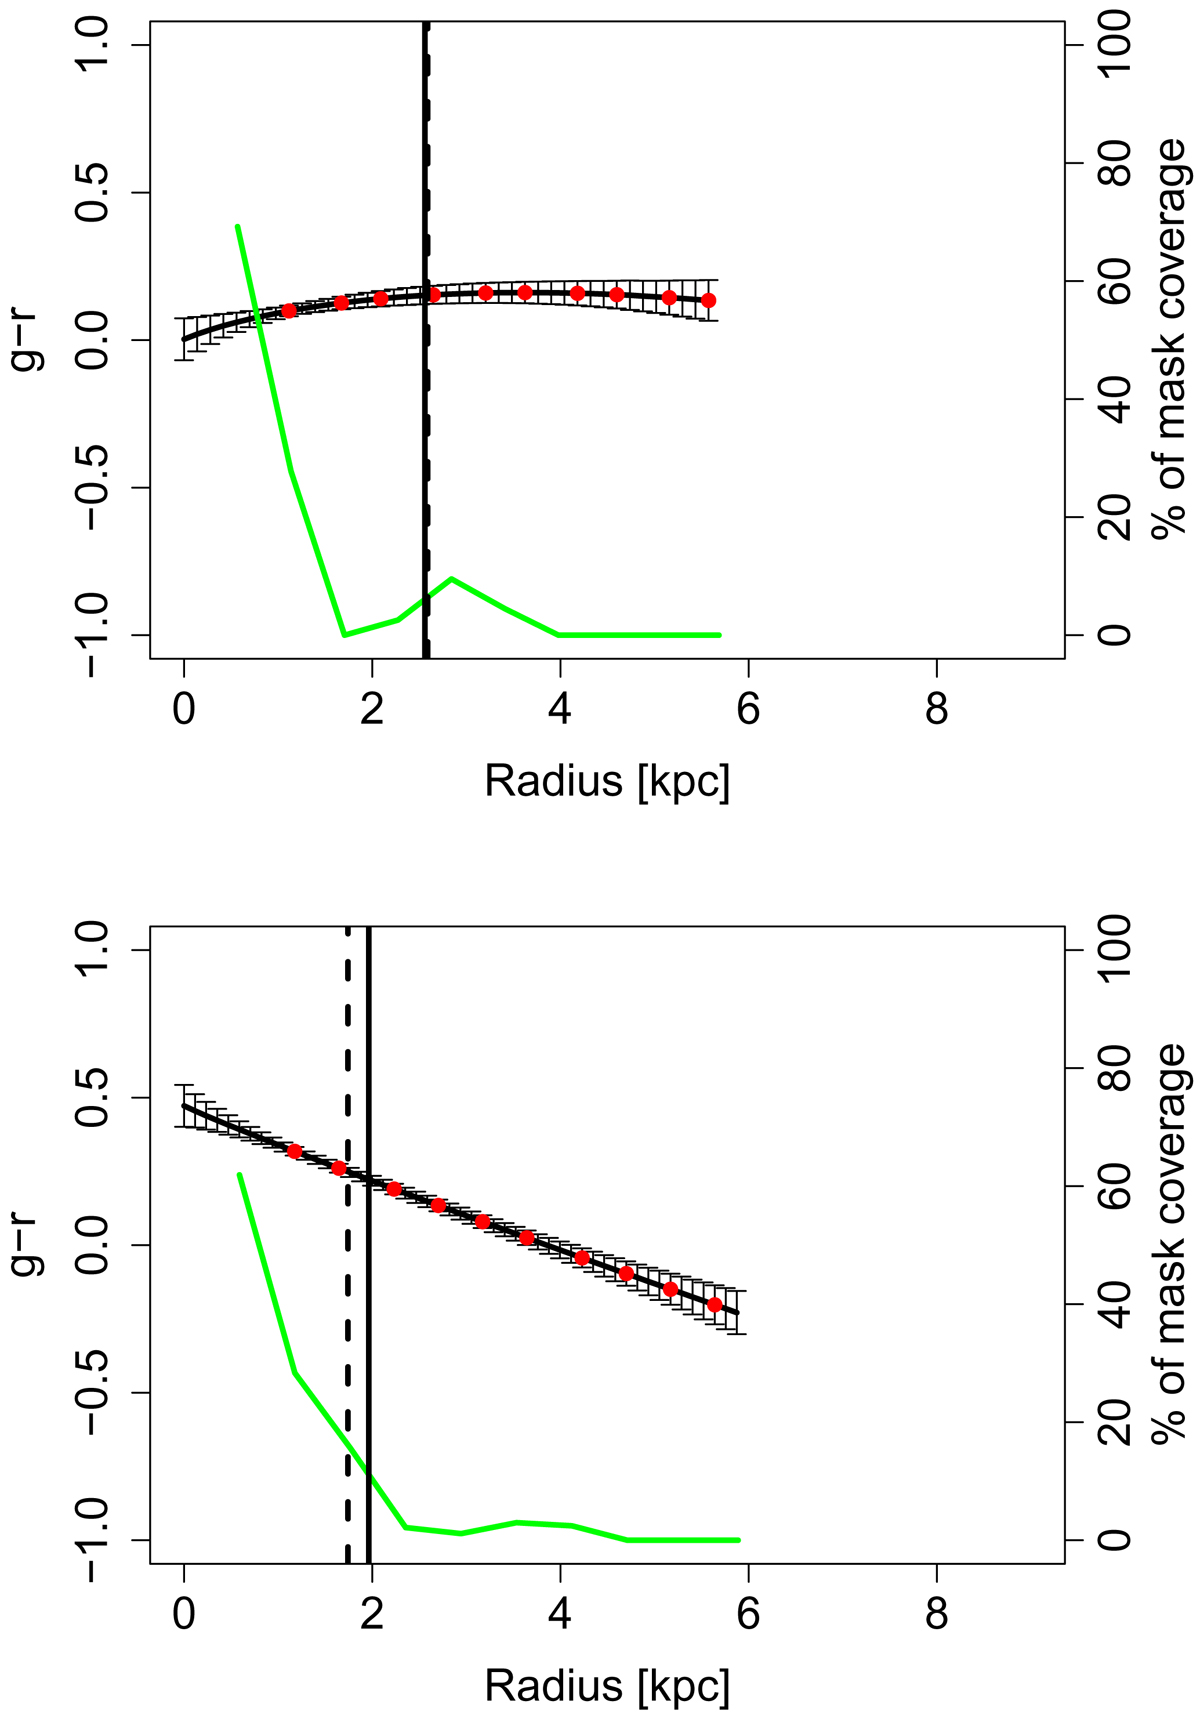
Examples of g − r color profiles for two galaxies in the sample. Top: galaxy with a flat color profile. Bottom: galaxy with a negative color gradient. The vertical dashed (solid) line shows the effective radius in the g(r) band. The green line represents the percentage of the area of the galaxy masked as a function of radius.
Current usage metrics show cumulative count of Article Views (full-text article views including HTML views, PDF and ePub downloads, according to the available data) and Abstracts Views on Vision4Press platform.
Data correspond to usage on the plateform after 2015. The current usage metrics is available 48-96 hours after online publication and is updated daily on week days.
Initial download of the metrics may take a while.