Fig. 5.
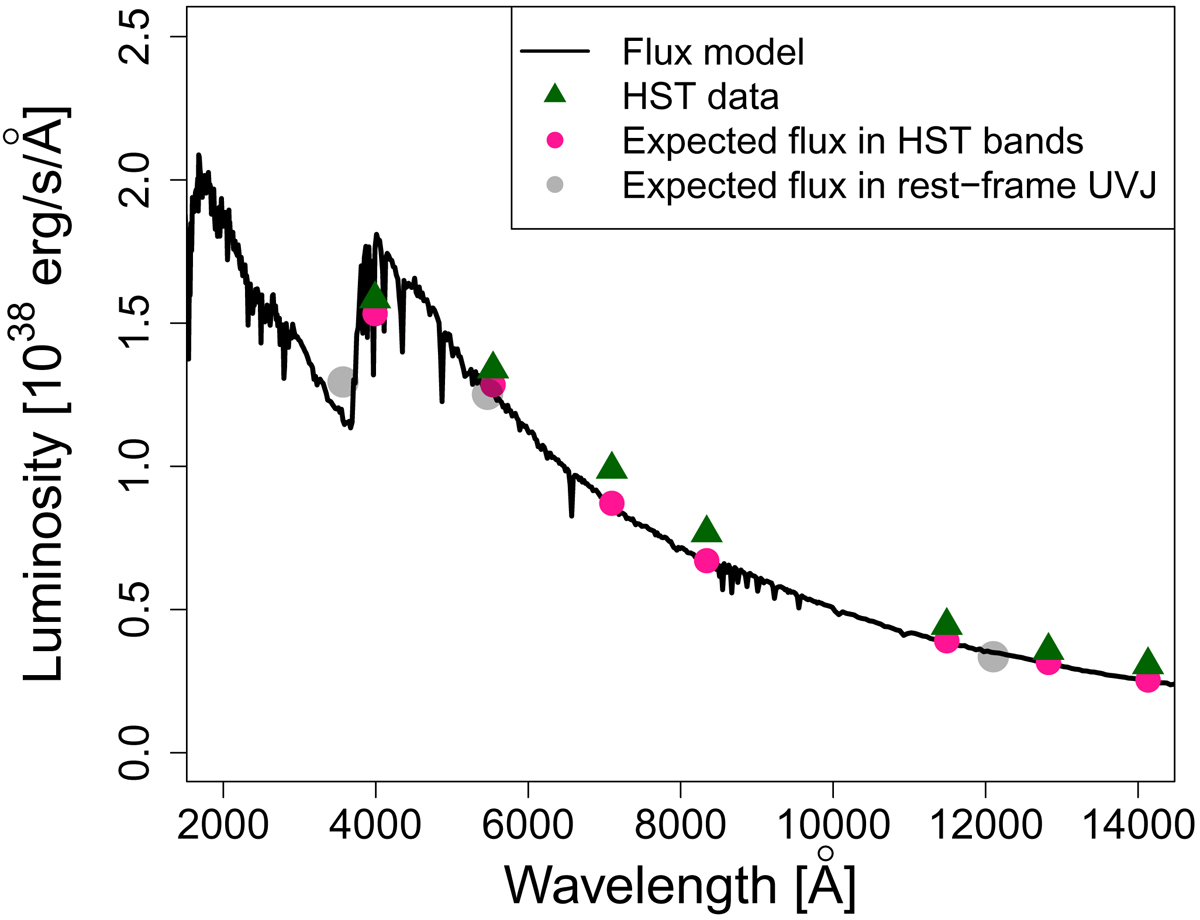
Example of the K-correction process. The composite stellar population model (from Paper I) is shown as a black line. The green triangles represent the integrated flux of the galaxy in each HST band. The pink circles are the expected flux in each HST band, considering only the stellar population model. The gray dots are the expected U, V and J fluxes considering the model. The K-correction is the difference between these fluxes and the expected values in the nearest HST filters.
Current usage metrics show cumulative count of Article Views (full-text article views including HTML views, PDF and ePub downloads, according to the available data) and Abstracts Views on Vision4Press platform.
Data correspond to usage on the plateform after 2015. The current usage metrics is available 48-96 hours after online publication and is updated daily on week days.
Initial download of the metrics may take a while.