Free Access
Fig. 4.
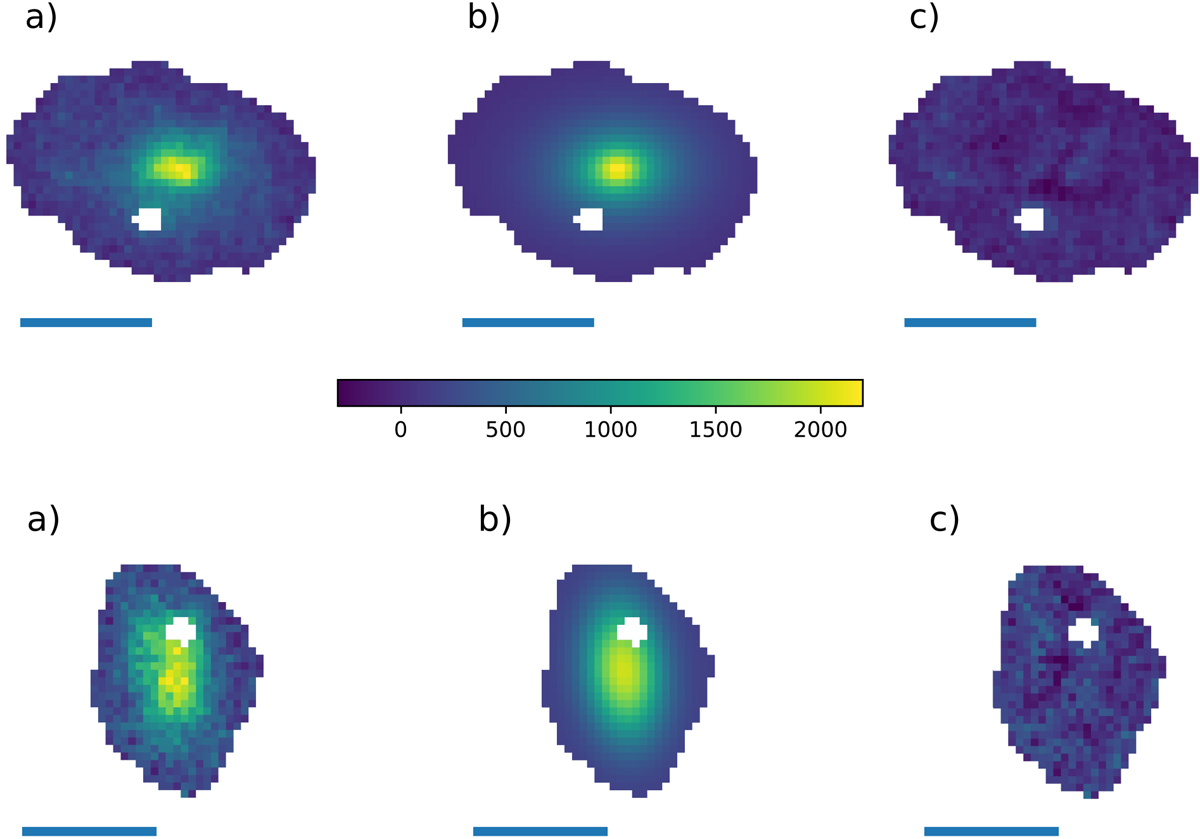
Example of two galaxies from our sample, with the original image and the Hα detection mask overlaid on it (left column), the Sérsic model (central column) and the residuals from the fit (right column). All images are presented with the same color scale, shown in the central color bar (in counts).
Current usage metrics show cumulative count of Article Views (full-text article views including HTML views, PDF and ePub downloads, according to the available data) and Abstracts Views on Vision4Press platform.
Data correspond to usage on the plateform after 2015. The current usage metrics is available 48-96 hours after online publication and is updated daily on week days.
Initial download of the metrics may take a while.