Fig. 10.
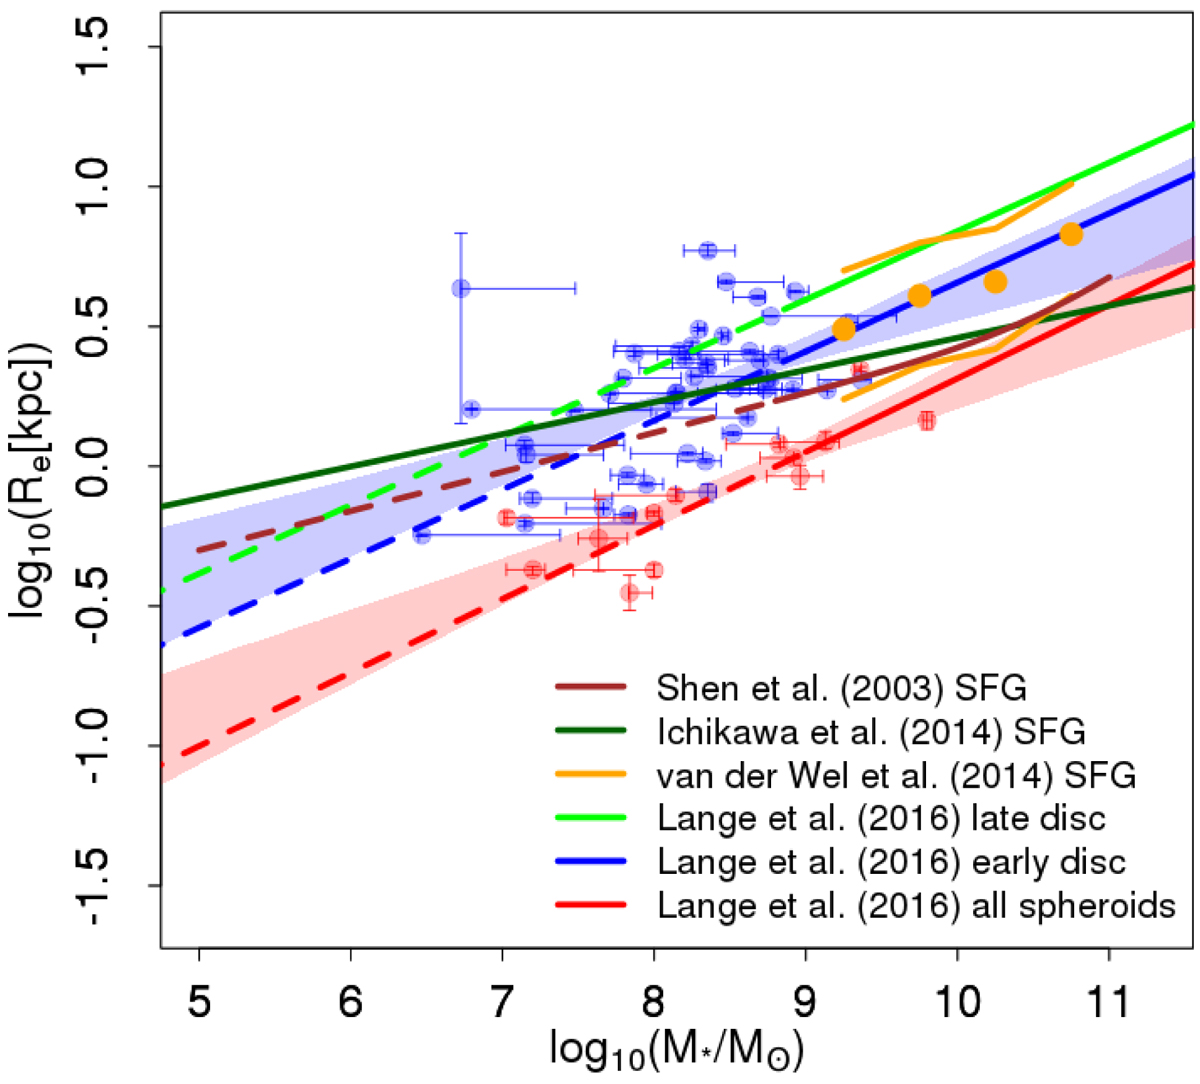
Mass-size relation of our sample of galaxies: galaxies that belong to class B (blue dots), and class A (red dots). The shaded blue (red) area is the 1σ limit for a linear fit to the blue (red) dots, using bootstrap and Monte Carlo simulations. The lines represent mass-size relations found in the literature (see legend). Lines are continuous until they reach the mass limit for each sample, from where we point extrapolations to lower masses as dashed lines.
Current usage metrics show cumulative count of Article Views (full-text article views including HTML views, PDF and ePub downloads, according to the available data) and Abstracts Views on Vision4Press platform.
Data correspond to usage on the plateform after 2015. The current usage metrics is available 48-96 hours after online publication and is updated daily on week days.
Initial download of the metrics may take a while.