Open Access
Fig. 9.
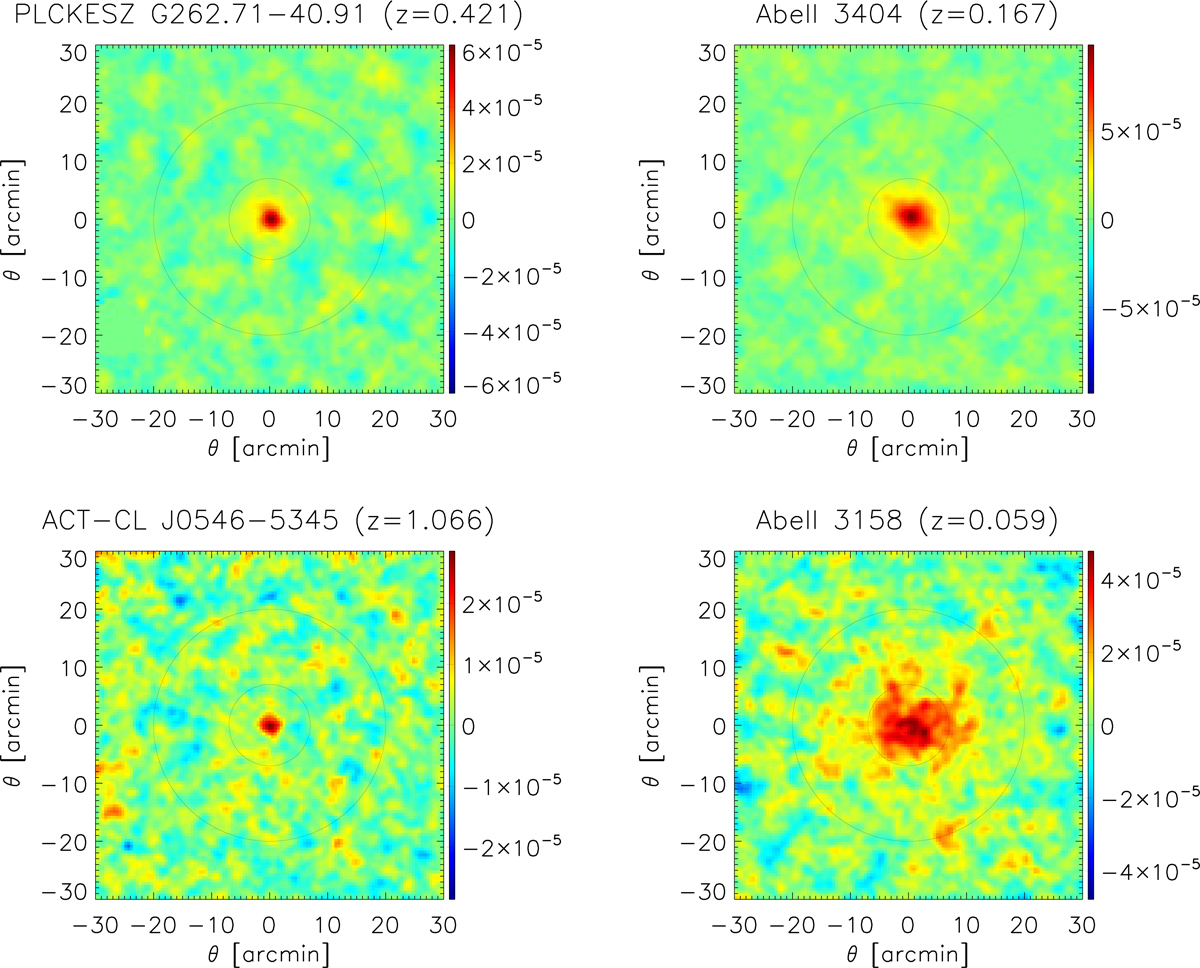
Cut-outs of tSZ signal from reconstructed PACT y-map for four selected galaxy clusters. The innermost black circle is for 1.4 arcmin (ACT resolution), the middle black circle represents the Planck resolution of 7 arcmin, and the outer black circle is drawn for a radius of 20 arcmin.
Current usage metrics show cumulative count of Article Views (full-text article views including HTML views, PDF and ePub downloads, according to the available data) and Abstracts Views on Vision4Press platform.
Data correspond to usage on the plateform after 2015. The current usage metrics is available 48-96 hours after online publication and is updated daily on week days.
Initial download of the metrics may take a while.