Open Access
Fig. 8.
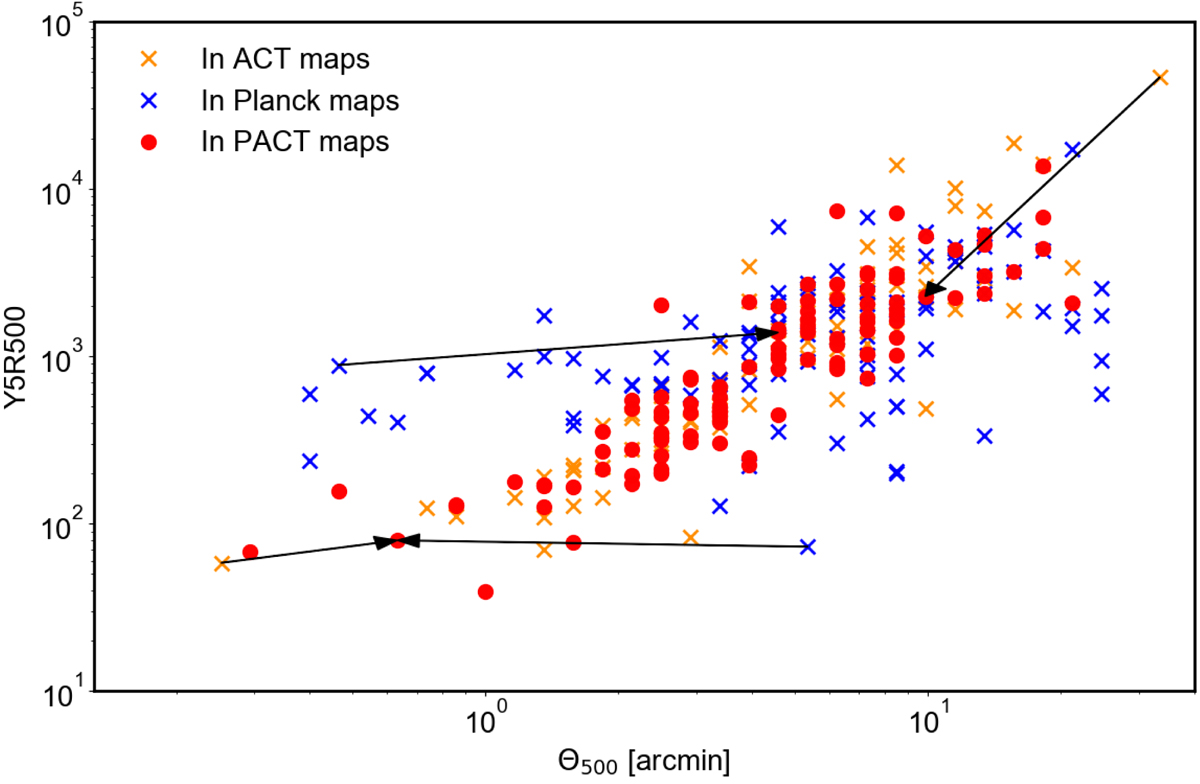
Comparison of Y and Θ values for 119 tSZ clusters in ACT, Planck, and PACT maps. Arrows show how the size and flux change when estimated in native ACT or Planck maps only or when using the full PACT dataset.
Current usage metrics show cumulative count of Article Views (full-text article views including HTML views, PDF and ePub downloads, according to the available data) and Abstracts Views on Vision4Press platform.
Data correspond to usage on the plateform after 2015. The current usage metrics is available 48-96 hours after online publication and is updated daily on week days.
Initial download of the metrics may take a while.