Fig. 7.
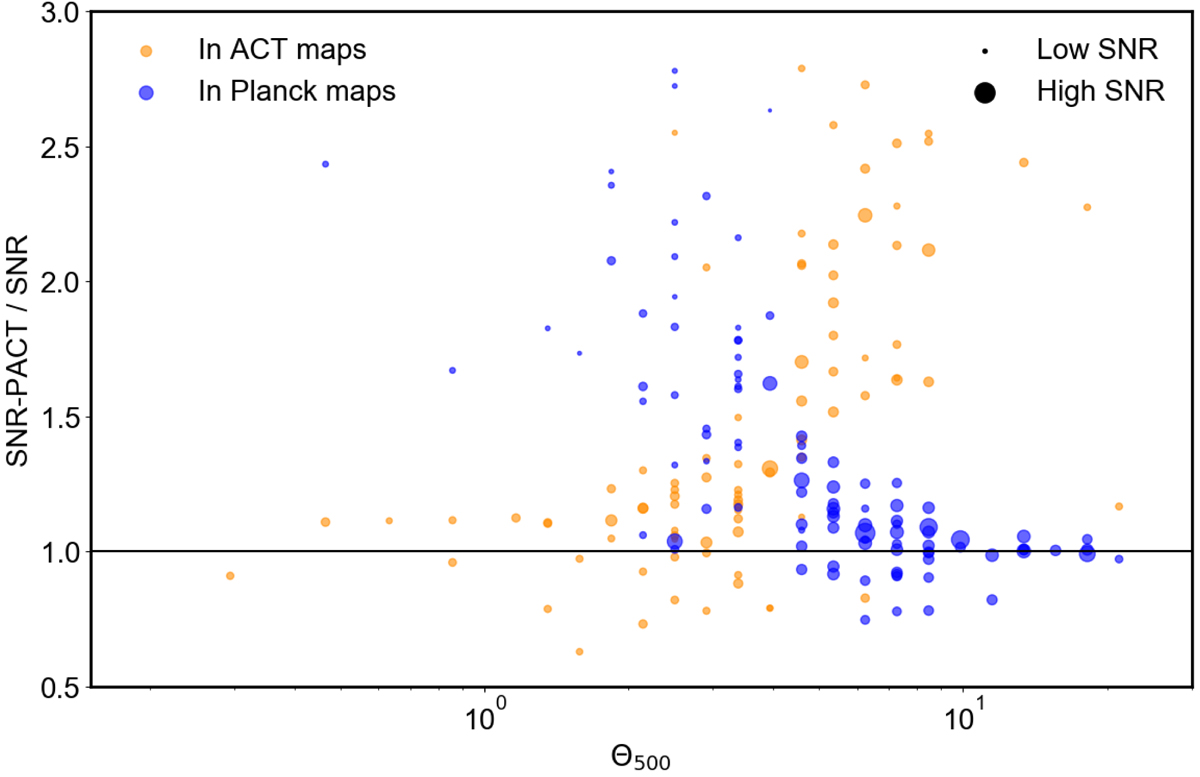
Comparison of S/N values for clusters in ACT, Planck, and PACT maps as function of angular size. The ratio of the S/N obtained from PACT to the S/N obtained from the native ACT data (orange dots) or Planck data (blue dots) is plotted versus the angular size of the cluster. Each dot stands for one of the 119 clusters reported in Planck or ACT catalogs with size of symbol proportional to the PACT S/N.
Current usage metrics show cumulative count of Article Views (full-text article views including HTML views, PDF and ePub downloads, according to the available data) and Abstracts Views on Vision4Press platform.
Data correspond to usage on the plateform after 2015. The current usage metrics is available 48-96 hours after online publication and is updated daily on week days.
Initial download of the metrics may take a while.