Open Access
Fig. 6.
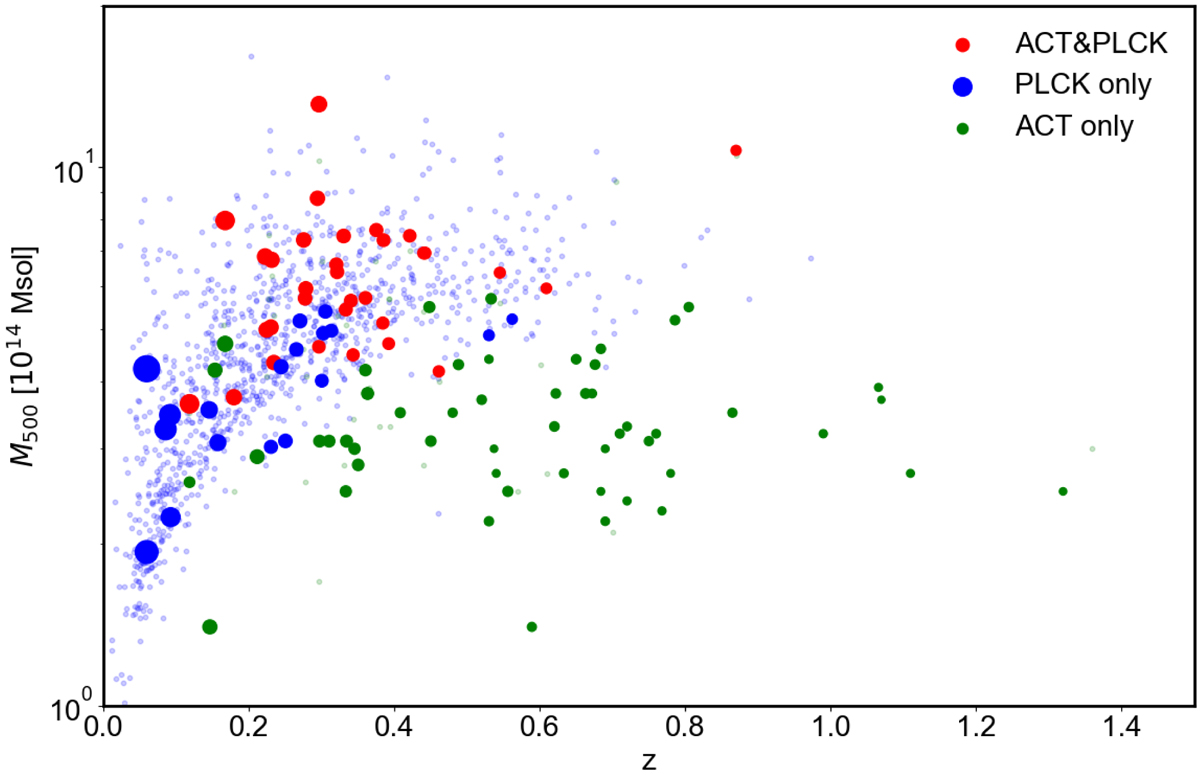
Distribution in mass, in units of M500, and in redshift of our sample (dots) compared with full Planck and ACT catalogs (light blue points). The colors indicate whether a cluster is detected by ACT (green dots), Planck (blue dots), or both (red dots). The size of the dots is proportional to the cluster size, Θ500.
Current usage metrics show cumulative count of Article Views (full-text article views including HTML views, PDF and ePub downloads, according to the available data) and Abstracts Views on Vision4Press platform.
Data correspond to usage on the plateform after 2015. The current usage metrics is available 48-96 hours after online publication and is updated daily on week days.
Initial download of the metrics may take a while.