Open Access
Fig. 5.
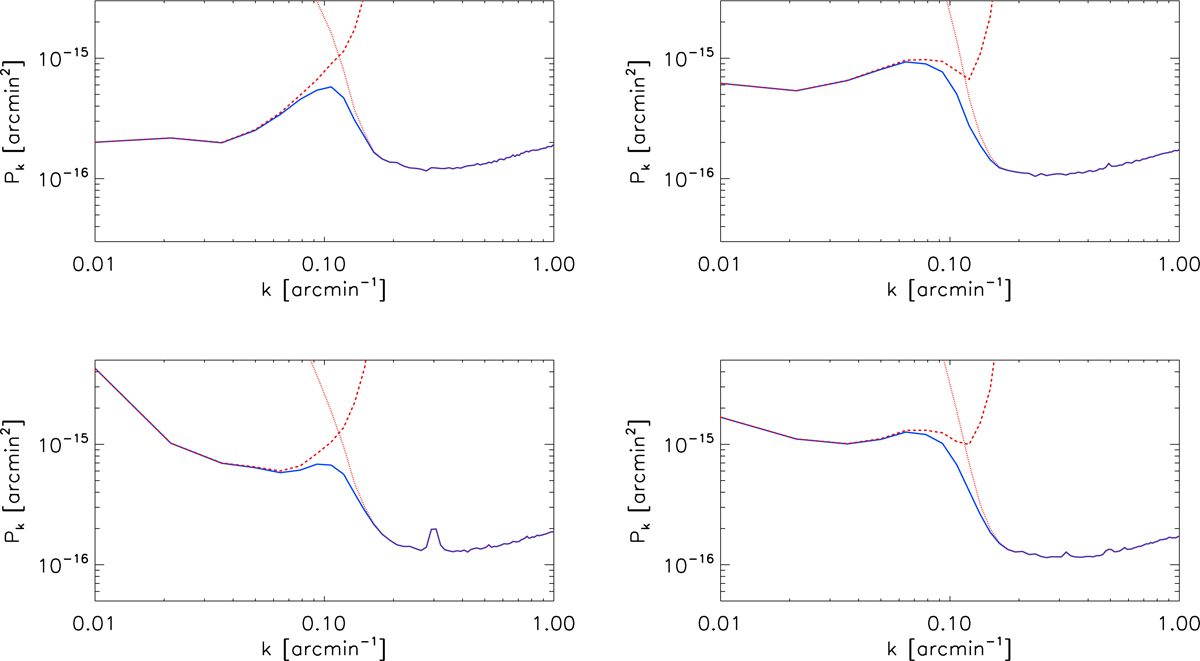
S/N of tSZ in pixel distribution of both PACT maps. Top: PACT tSZ noise power-spectrum (solid blue) compared with Planck and ACT noise power-spectrum (in dashed and dotted red lines) for the southern region (left panel) and the equatorial region (right panel). Bottom: same as the top but for the tSZ signal.
Current usage metrics show cumulative count of Article Views (full-text article views including HTML views, PDF and ePub downloads, according to the available data) and Abstracts Views on Vision4Press platform.
Data correspond to usage on the plateform after 2015. The current usage metrics is available 48-96 hours after online publication and is updated daily on week days.
Initial download of the metrics may take a while.