Open Access
Fig. 4.
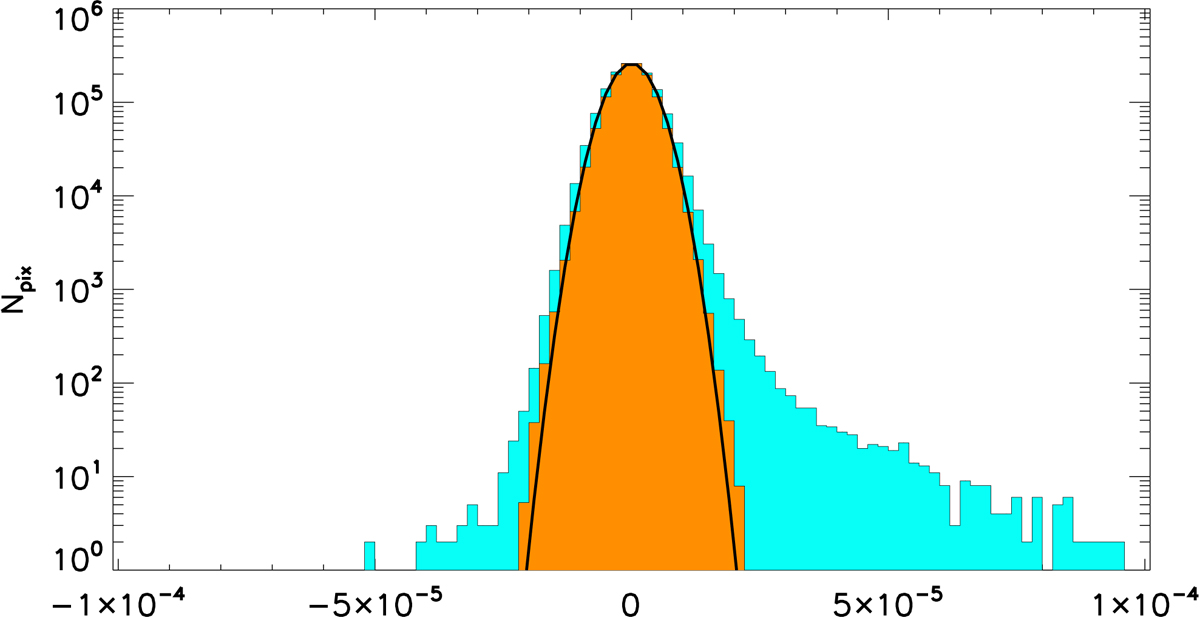
Distribution of pixels for MILCA PACT y-map. The tSZ signal is shown in light blue, and the noise is shown in orange. The solid black line shows a Gaussian fit adjusted to the noise distribution.
Current usage metrics show cumulative count of Article Views (full-text article views including HTML views, PDF and ePub downloads, according to the available data) and Abstracts Views on Vision4Press platform.
Data correspond to usage on the plateform after 2015. The current usage metrics is available 48-96 hours after online publication and is updated daily on week days.
Initial download of the metrics may take a while.