Fig. 3.
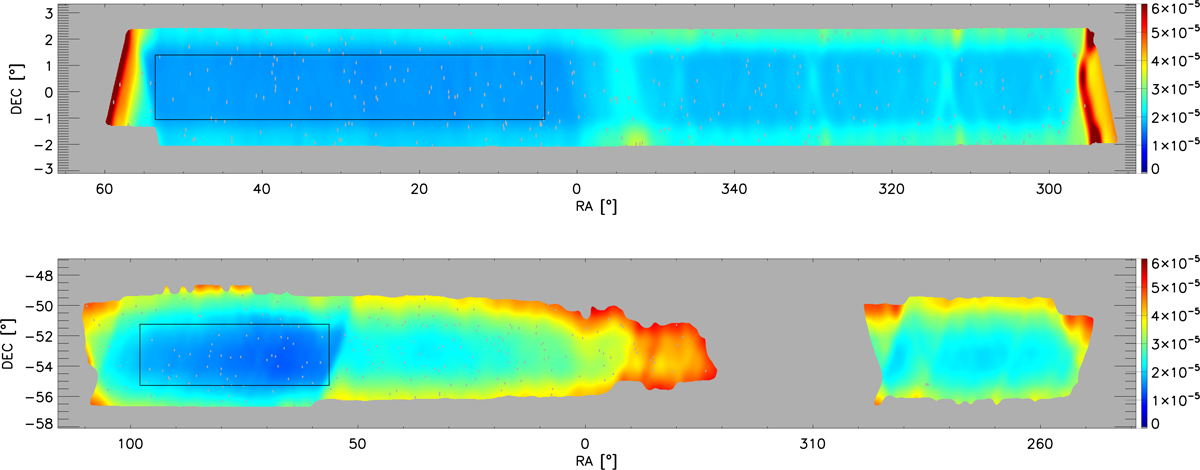
Combined noise maps in native ACT resolution of 1.4 arcmin, overlaid with ACT point-source masks. The color bar represents the unitless Compton y parameter. Top: ACT equatorial area. Bottom: ACT southern area. The rectangle in each panel represents the deepest area Sdeep (in the southern region) and Edeep (in the equatorial region).
Current usage metrics show cumulative count of Article Views (full-text article views including HTML views, PDF and ePub downloads, according to the available data) and Abstracts Views on Vision4Press platform.
Data correspond to usage on the plateform after 2015. The current usage metrics is available 48-96 hours after online publication and is updated daily on week days.
Initial download of the metrics may take a while.