Fig. 2.
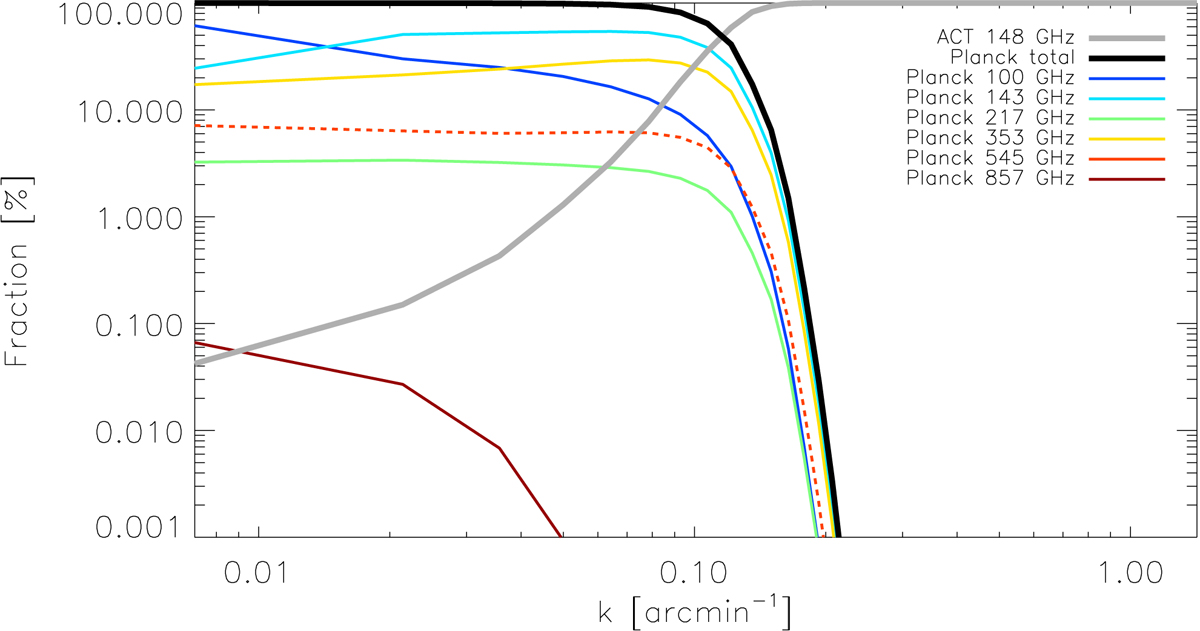
Relative contribution, i.e., weights, as a function of scales to reconstructed PACT y-map of each frequency channel. Shown are 100 GHz in dark blue, 143 GHz in light blue, 148 GHz in gray, 217 GHz in green, 353 GHz in yellow, 545 GHz in red, and 857 GHz in brown. The relative contribution to the reconstructed PACT y-map from Planck is shown as thick black line.
Current usage metrics show cumulative count of Article Views (full-text article views including HTML views, PDF and ePub downloads, according to the available data) and Abstracts Views on Vision4Press platform.
Data correspond to usage on the plateform after 2015. The current usage metrics is available 48-96 hours after online publication and is updated daily on week days.
Initial download of the metrics may take a while.