Open Access
Fig. 10.
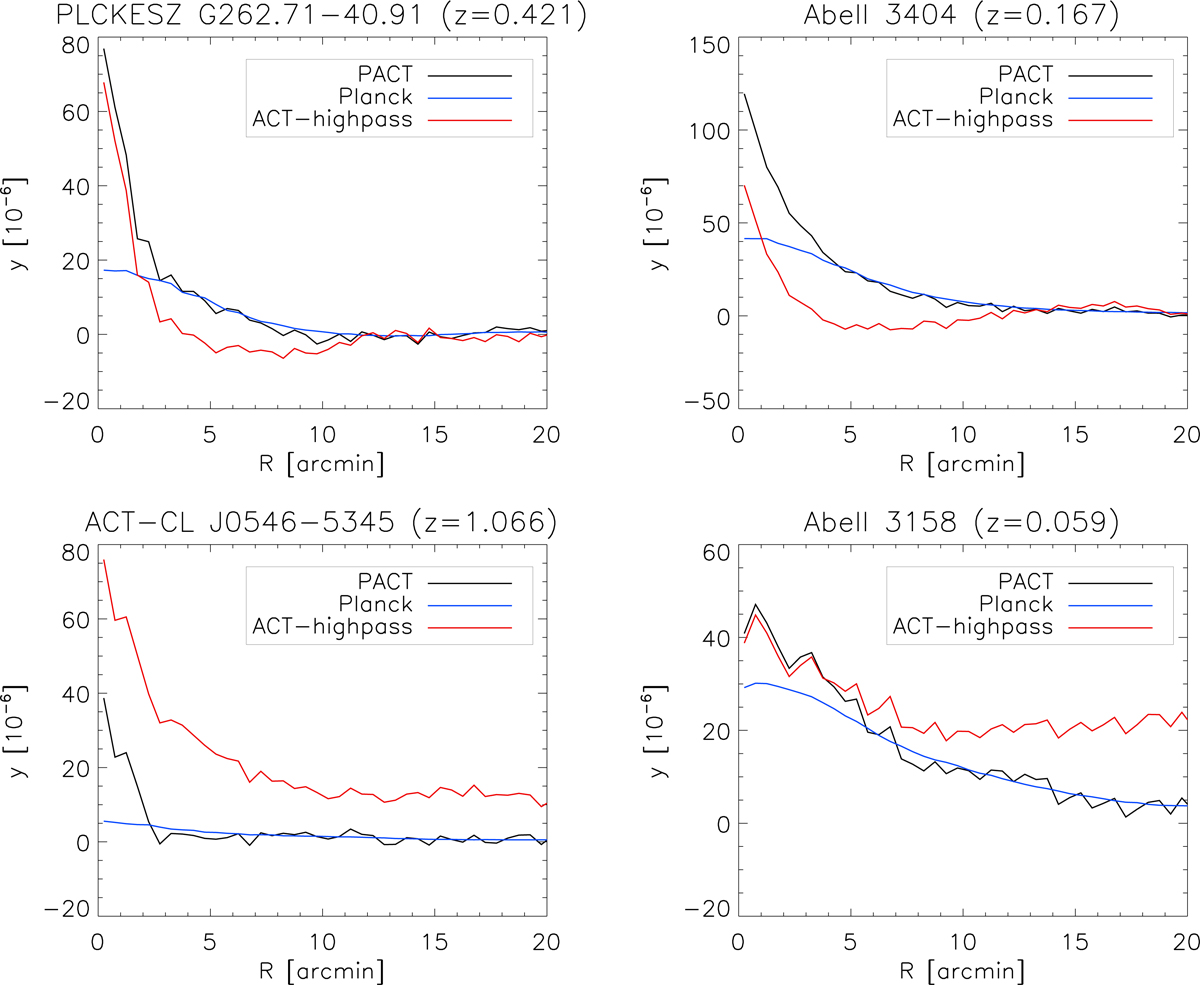
Comparison of the radial tSZ profiles for four clusters in Fig. 9. Profiles were obtained from the PACT y-map (black), from the Plancky-map (blue), and the 148 GHz-ACT high-pass filtered map (red).
Current usage metrics show cumulative count of Article Views (full-text article views including HTML views, PDF and ePub downloads, according to the available data) and Abstracts Views on Vision4Press platform.
Data correspond to usage on the plateform after 2015. The current usage metrics is available 48-96 hours after online publication and is updated daily on week days.
Initial download of the metrics may take a while.