Fig. 1.
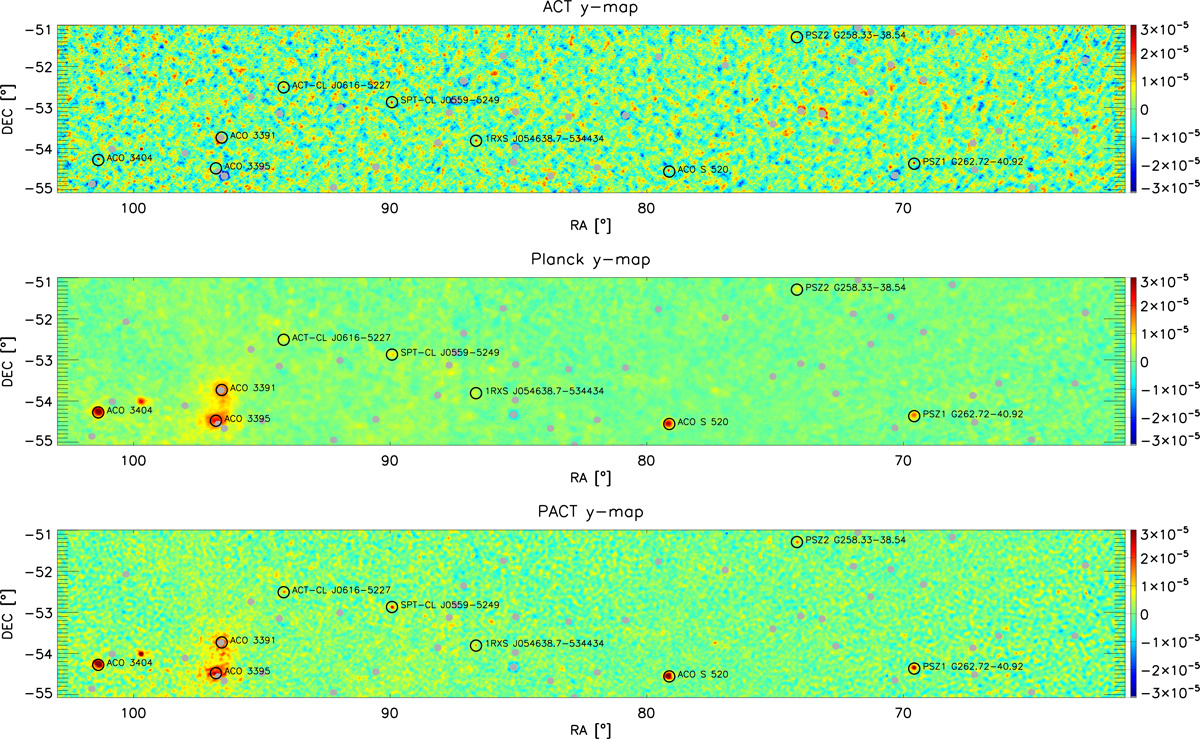
Maps of unitless (color bar) Compton y parameter illustrated on selected southern ACT area. Top panel: 148 GHz-ACT map at 1.5 arcmin resolution with scales larger than 7 arcmin filtered out. Middle panel: Plancky-map reconstructed with a modified internal linear component algorithm (MILCA) at 7 arcmin resolution. Lower panel: PACT y-map reconstructed with MILCA at 3 arcmin resolution. Circles indicate some known clusters in the selected area. The ACT point sources are masked in all three panels (gray areas).
Current usage metrics show cumulative count of Article Views (full-text article views including HTML views, PDF and ePub downloads, according to the available data) and Abstracts Views on Vision4Press platform.
Data correspond to usage on the plateform after 2015. The current usage metrics is available 48-96 hours after online publication and is updated daily on week days.
Initial download of the metrics may take a while.