Fig. 8.
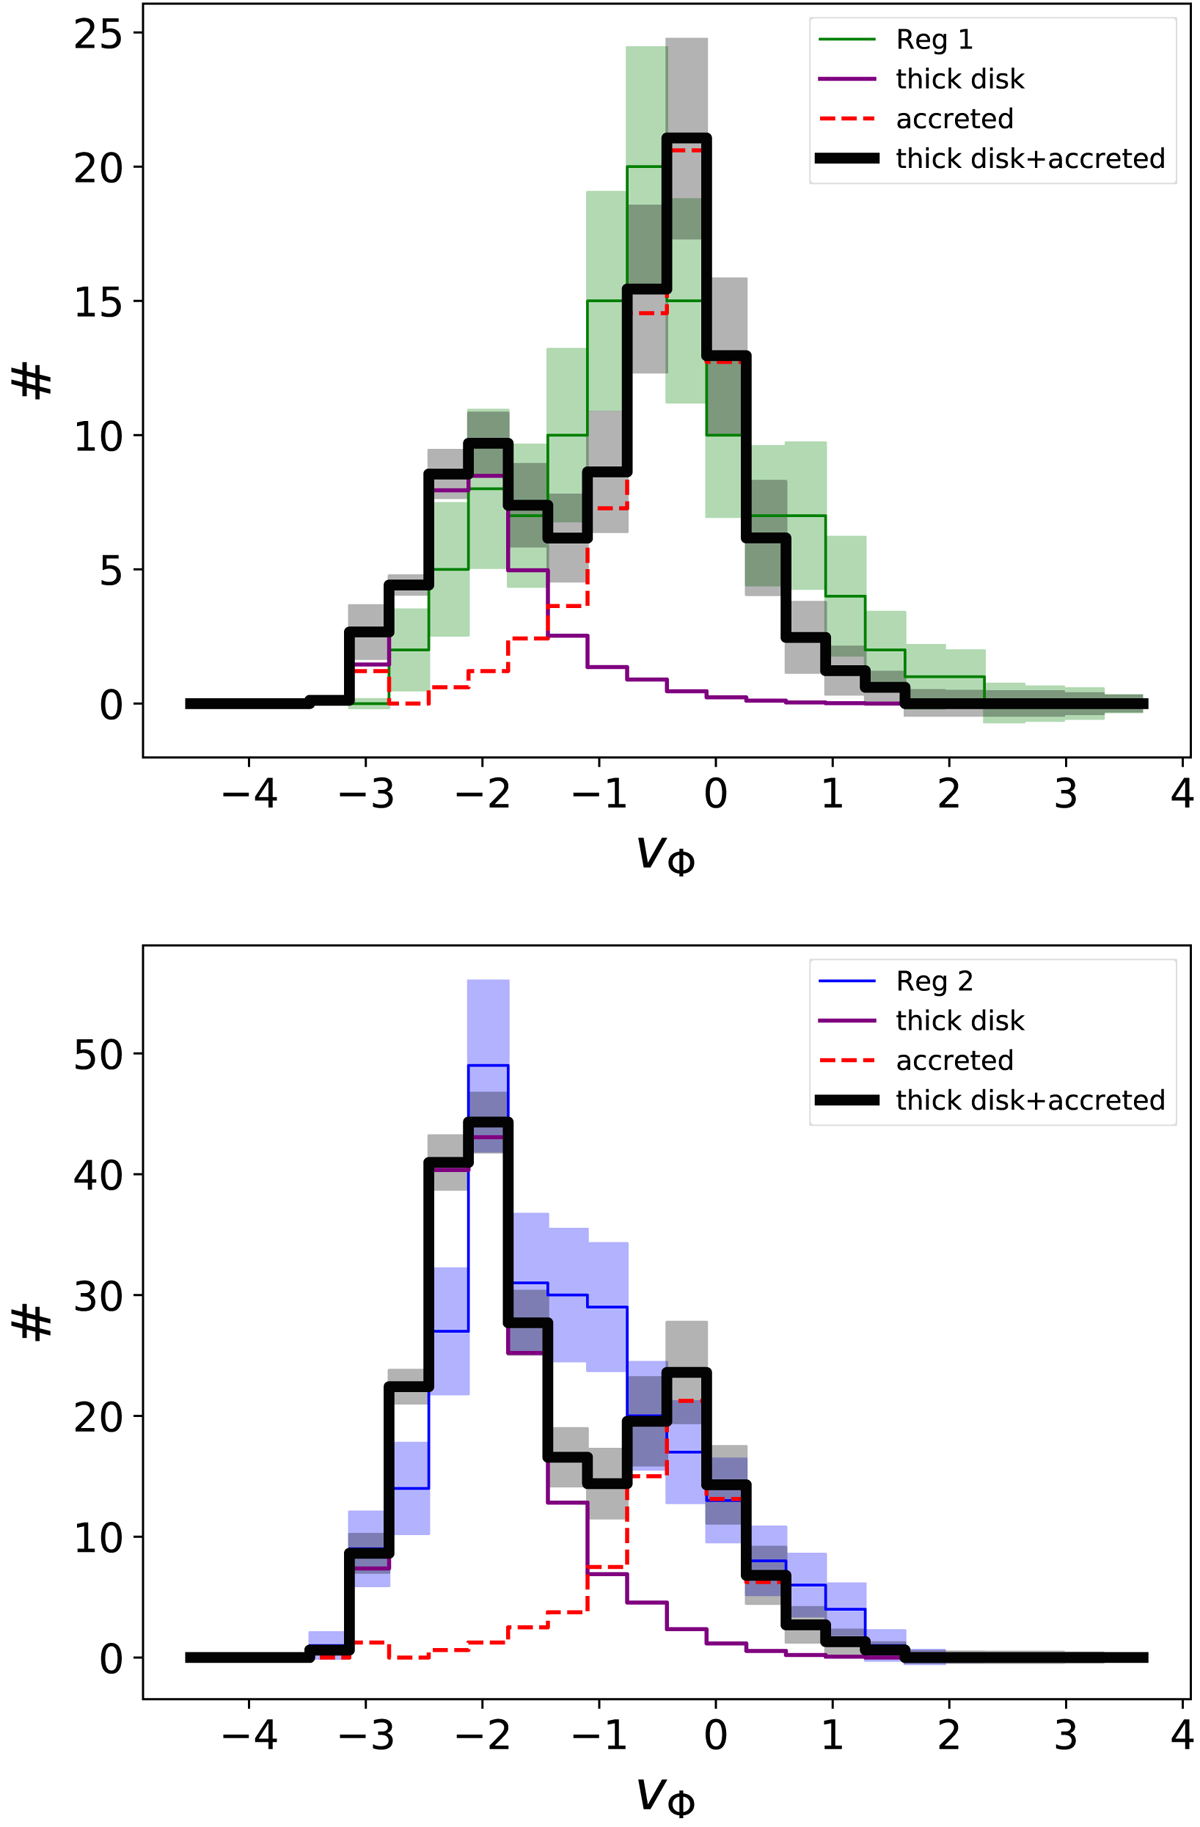
Absolute distribution of the azimuthal velocities, vΦ, for stars in Regions 1 (top panel) and 2 (bottom panel). Also shown are histograms of distributions of Regions 3 and 5 (solid purple and dashed red lines, respectively), normalised as described in the text, and their sum (thick black lines). The 1σ uncertainty in the distribution of stars in Regions 1 and 2 are shown, respectively, by green and blue shaded regions (top and bottom panels), and the uncertainty in the normalised sum of Regions 3 and 5 is shown by a grey shaded area. All uncertainties have been estimated by taking into account both the statistical uncertainty, through 1000 bootstrapped realisations, and the individual uncertainties propagated from the observables. In all panels: velocities are in units of 100 km s−1.
Current usage metrics show cumulative count of Article Views (full-text article views including HTML views, PDF and ePub downloads, according to the available data) and Abstracts Views on Vision4Press platform.
Data correspond to usage on the plateform after 2015. The current usage metrics is available 48-96 hours after online publication and is updated daily on week days.
Initial download of the metrics may take a while.