Fig. 7.
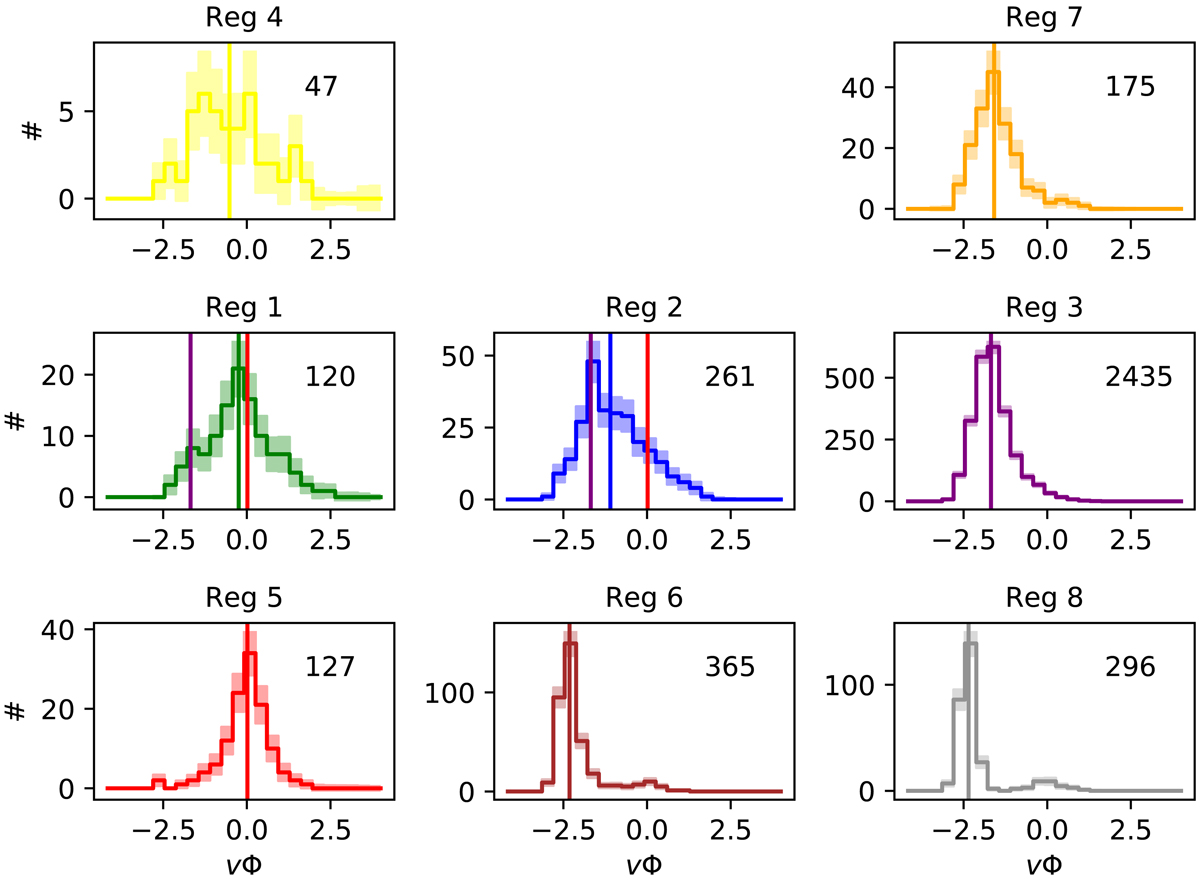
Absolute distribution of azimuthal velocities, vΦ, for stars in eight regions shown in Fig. 6 (see Sect. 3.2). In all panels: velocities are in units of 100 km s−1, and the solid coloured lines correspond to the medians of the distributions. In Regions 1 and 2, the solid purple and red lines correspond to the medians of the vΦ distributions in Regions 3 and 5, respectively. The number of stars in each region is provided in the upper-left corner of each panel. The 1σ uncertainties (coloured, shaded regions) have been estimated by taking into account both the statistical uncertainty, through 1000 bootstrapped realisations, and the individual uncertainties propagated from the observables.
Current usage metrics show cumulative count of Article Views (full-text article views including HTML views, PDF and ePub downloads, according to the available data) and Abstracts Views on Vision4Press platform.
Data correspond to usage on the plateform after 2015. The current usage metrics is available 48-96 hours after online publication and is updated daily on week days.
Initial download of the metrics may take a while.