Fig. 4.
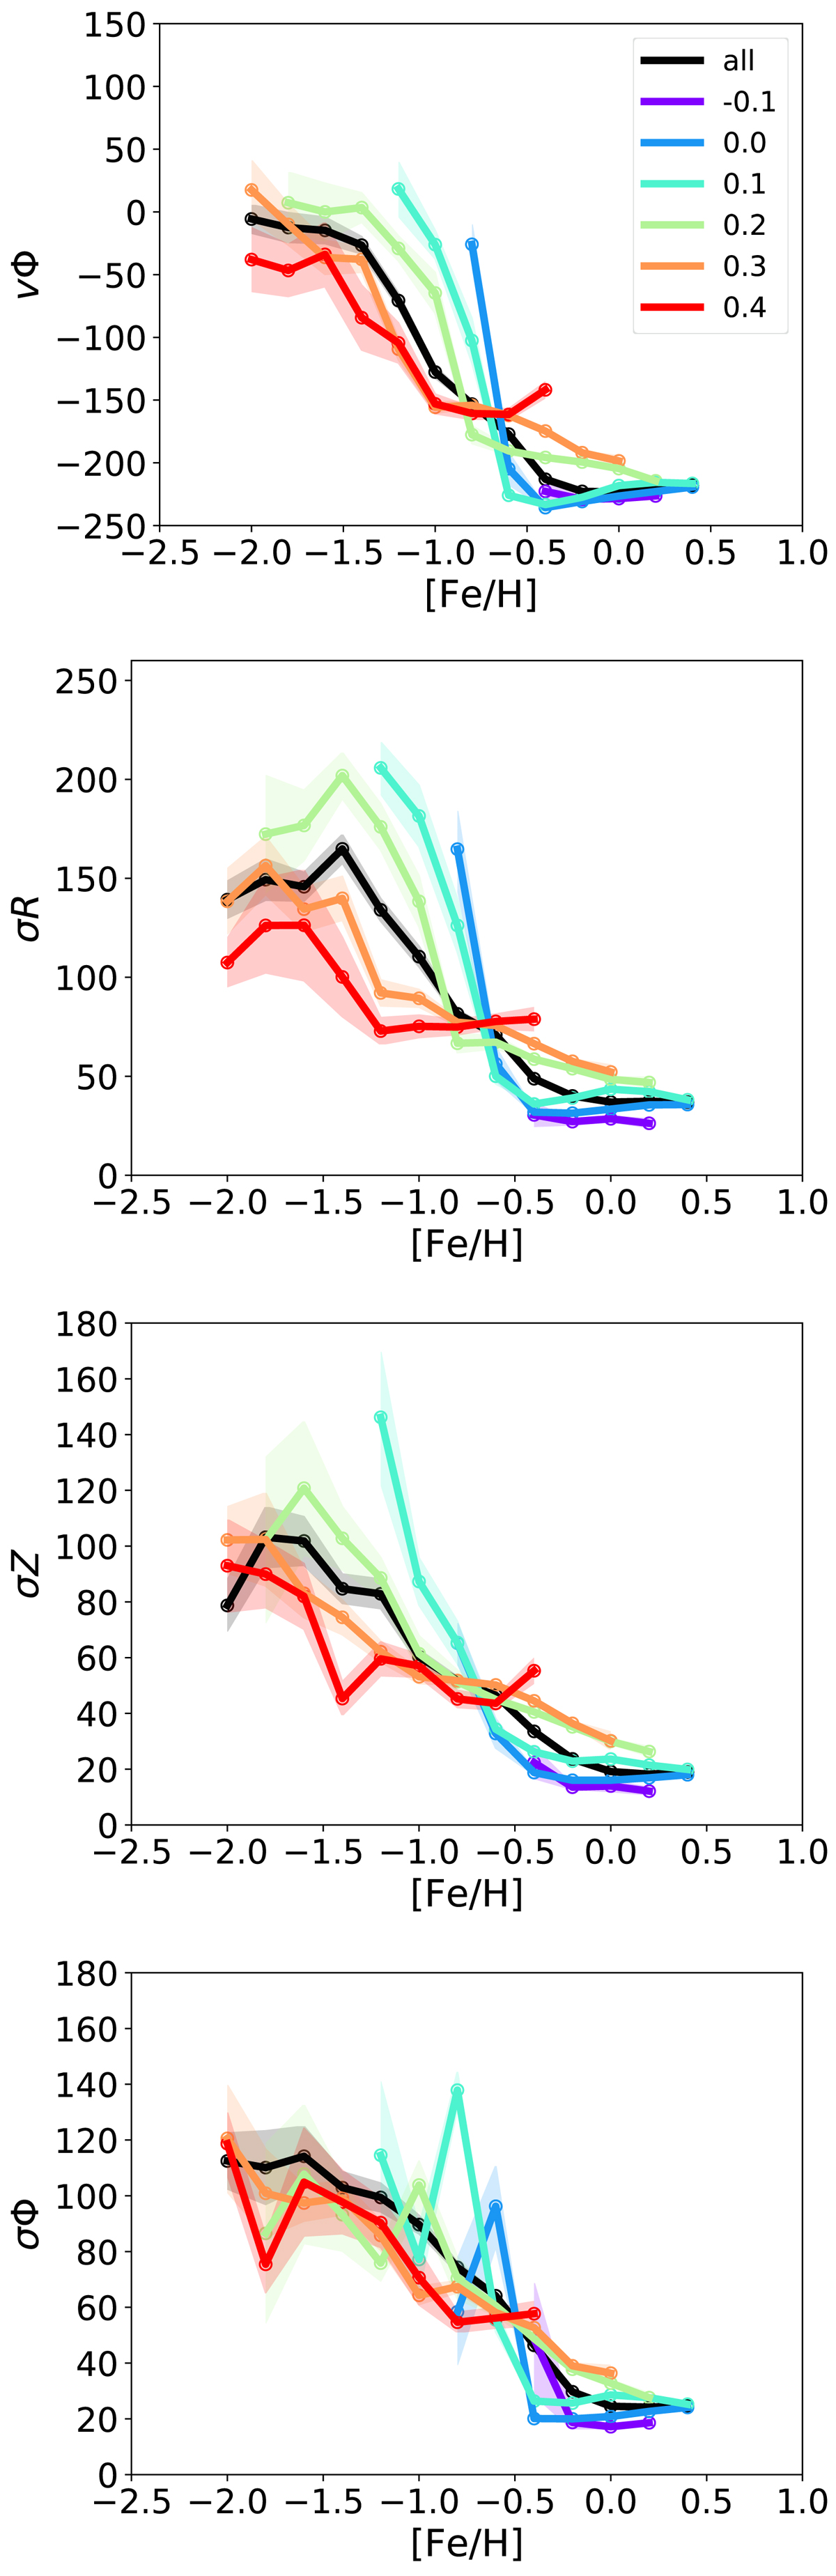
Panels from top to bottom: mean azimuthal velocity, radial, vertical and azimuthal velocity dispersion of stars, as a function of their [Fe/H] abundance. In each panel, the relations are for various bins in [Mg/Fe], as indicated in the legend in the top panel. The black curves in each panel show the relation for the total sample. The 1σ uncertainty in each relation (coloured region around each relation) is estimated using 1000 bootstrapped realizations. In all panels, only bins containing more than 10 stars are shown.
Current usage metrics show cumulative count of Article Views (full-text article views including HTML views, PDF and ePub downloads, according to the available data) and Abstracts Views on Vision4Press platform.
Data correspond to usage on the plateform after 2015. The current usage metrics is available 48-96 hours after online publication and is updated daily on week days.
Initial download of the metrics may take a while.