Fig. A.3.
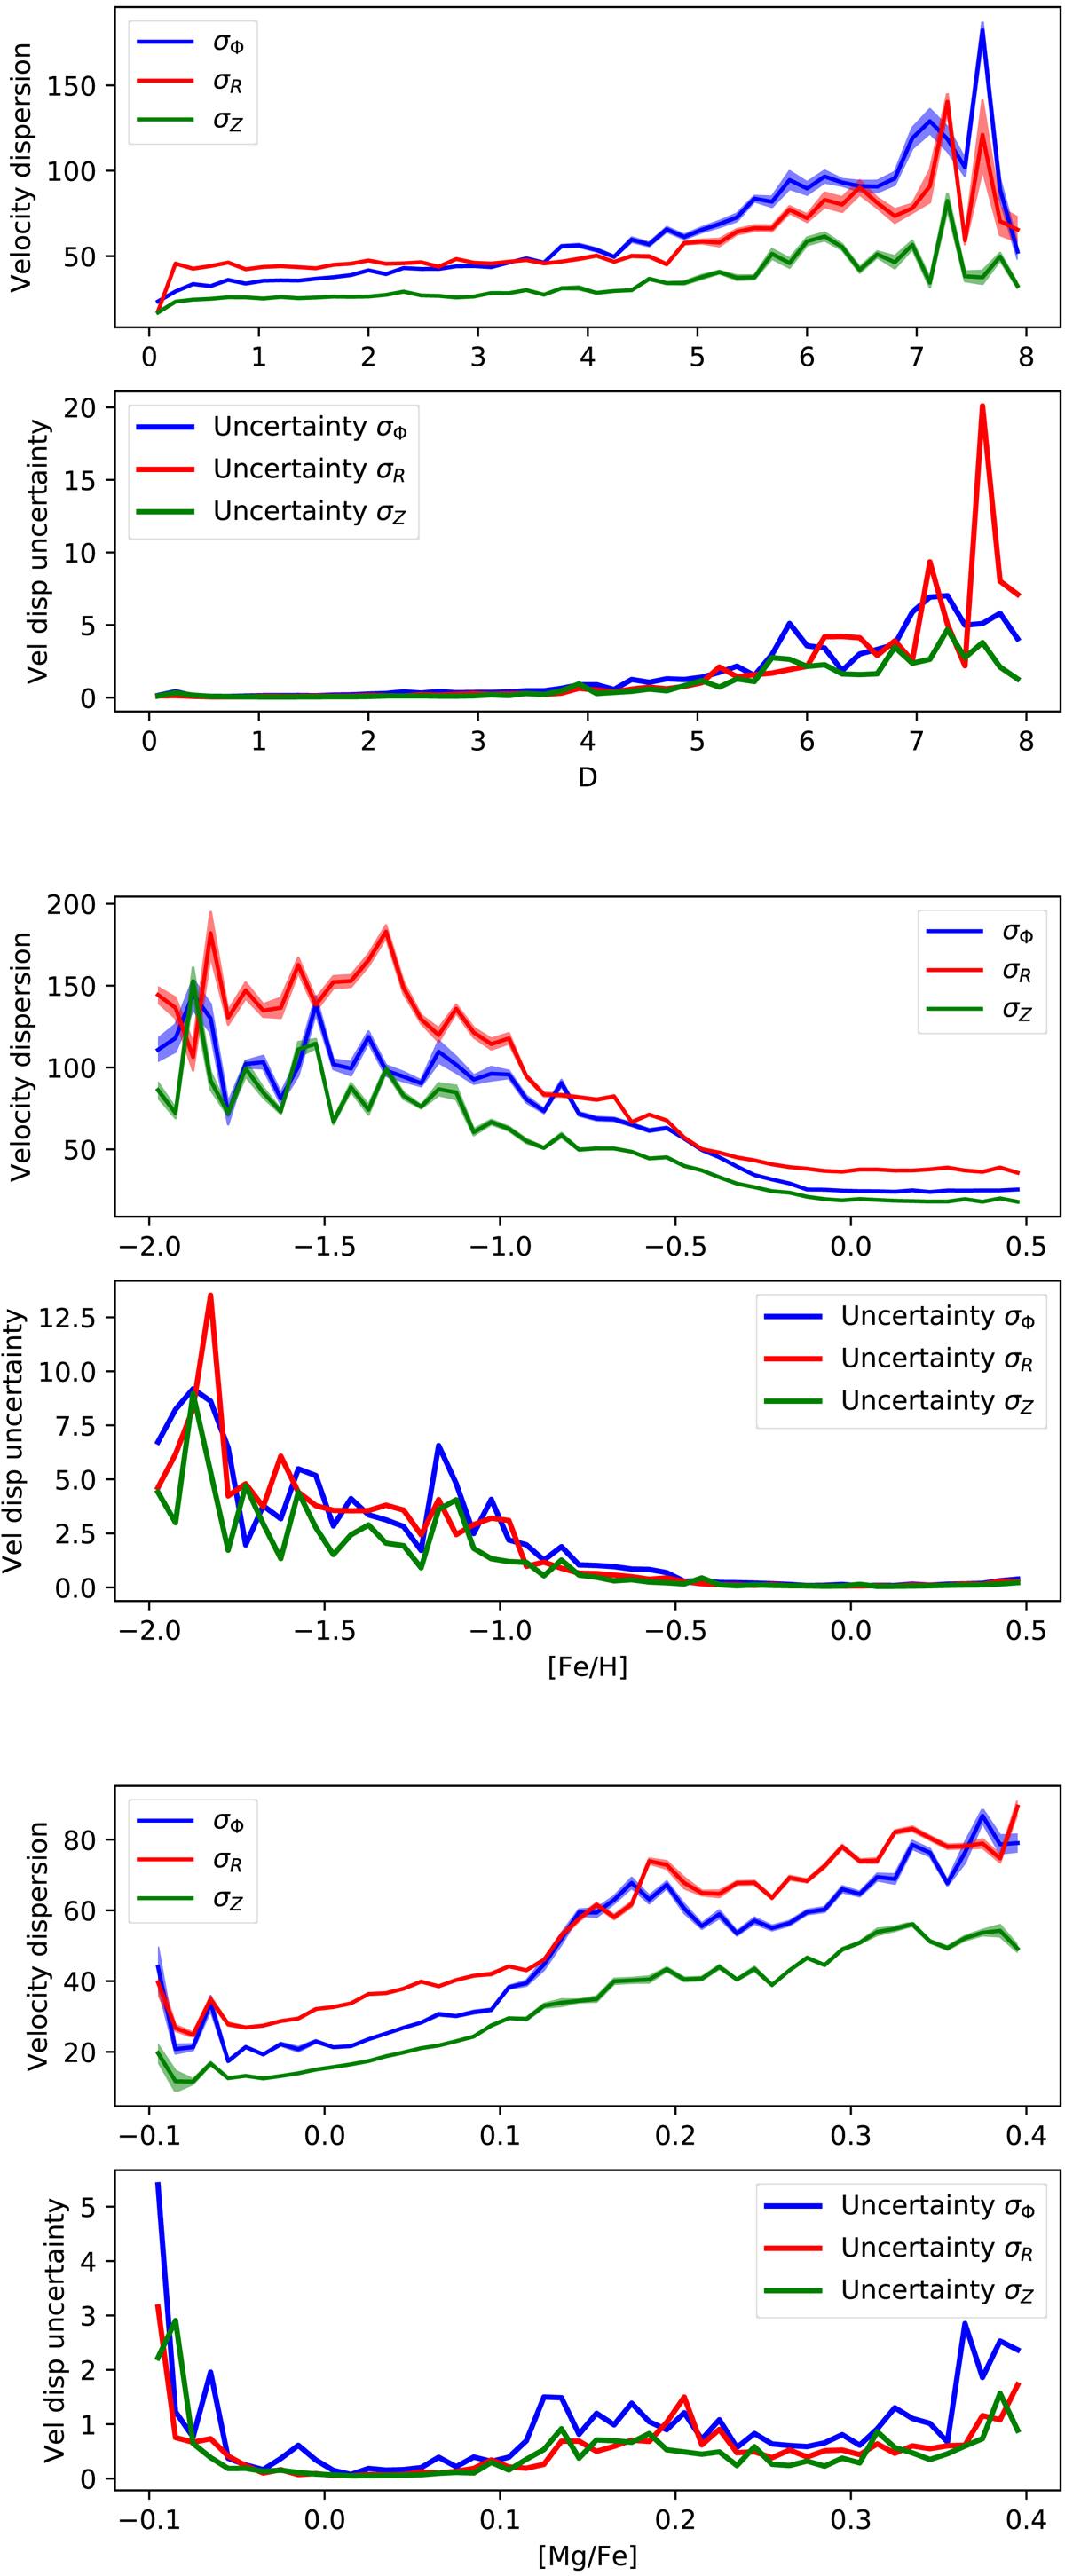
Top figure: velocity dispersion (top panel) and velocity dispersion uncertainty (bottom panel) as a function of distance D from the Sun. Blue, red and green curves correspond to the velocity dispersions in the aziumthal, radial and vertical directions, as indicated in the legend. Bottom panel: solid lines indicate the mean relation, and the colour-shaded areas indicate the 1σ uncertainty, estimated through 100 random realisations, from the uncertainties on the observables (see text). These uncertainties are then reported in the bottom panel. Middle and bottom figures: as above, but now velocity dispersions and corresponding uncertainties are shown as a function of [Fe/H] and [Mg/Fe], respectively. In all plots, velocities are in units of km s−1.
Current usage metrics show cumulative count of Article Views (full-text article views including HTML views, PDF and ePub downloads, according to the available data) and Abstracts Views on Vision4Press platform.
Data correspond to usage on the plateform after 2015. The current usage metrics is available 48-96 hours after online publication and is updated daily on week days.
Initial download of the metrics may take a while.