Fig. A.2.
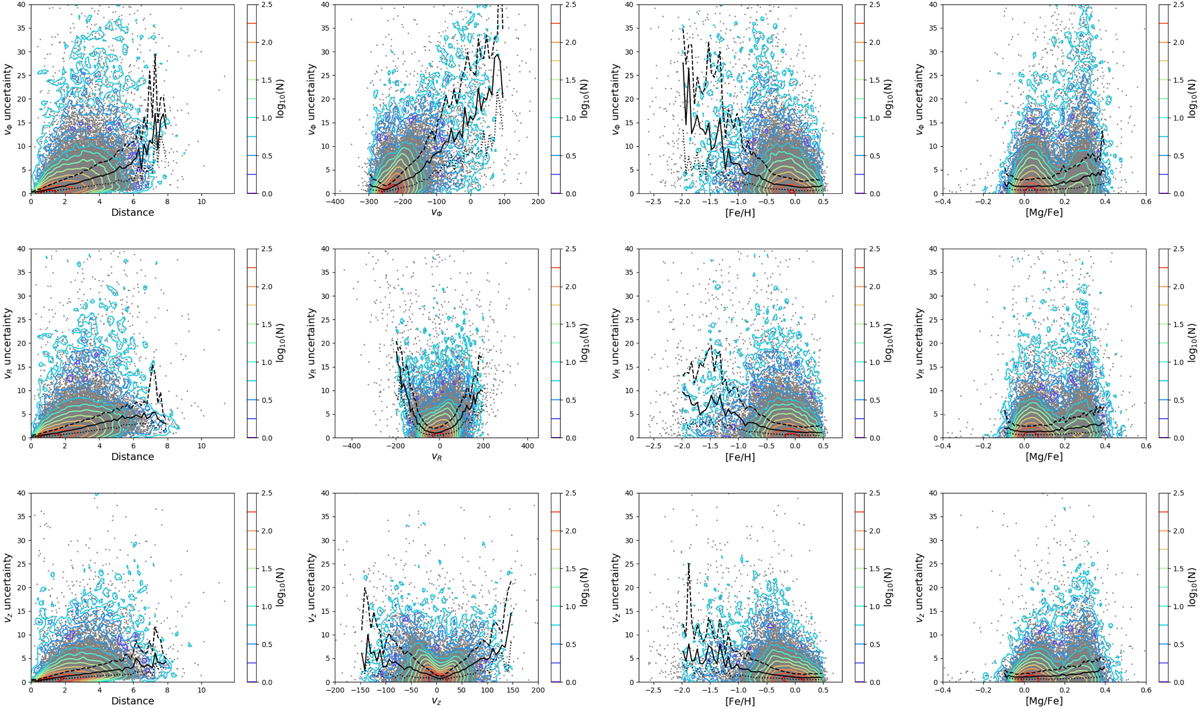
First column: uncertainties in vΦ (first row), vR (second row) and vz (third row) of stars as a function of their distance D from the Sun. Distances are given in kpc. Second column: uncertainties in vΦ (first row), vR (second row) and vz (third row) of stars as a function of corresponding velocity (given in km s−1). Third column: uncertainties in vΦ (first row), vR (second row) and vz (third row) of stars as a function of [Fe/H]. Fourth column: Uncertainties in vΦ (first row), vR (second row) and vz (third row) of stars as a function of [Mg/Fe]. In all panels: individual uncertainties are shown with grey points; their density distributions, in logarithmic scale, are indicated by coloured contours, whose corresponding values are reported in the error bars; the dotted, solid and dashed black lines show, respectively, the 25th, 50th (median) and 75th percentile of the distribution of uncertainties, as a function of the value reported on the x-axis. All velocity uncertainties are given in units of km s−1.
Current usage metrics show cumulative count of Article Views (full-text article views including HTML views, PDF and ePub downloads, according to the available data) and Abstracts Views on Vision4Press platform.
Data correspond to usage on the plateform after 2015. The current usage metrics is available 48-96 hours after online publication and is updated daily on week days.
Initial download of the metrics may take a while.