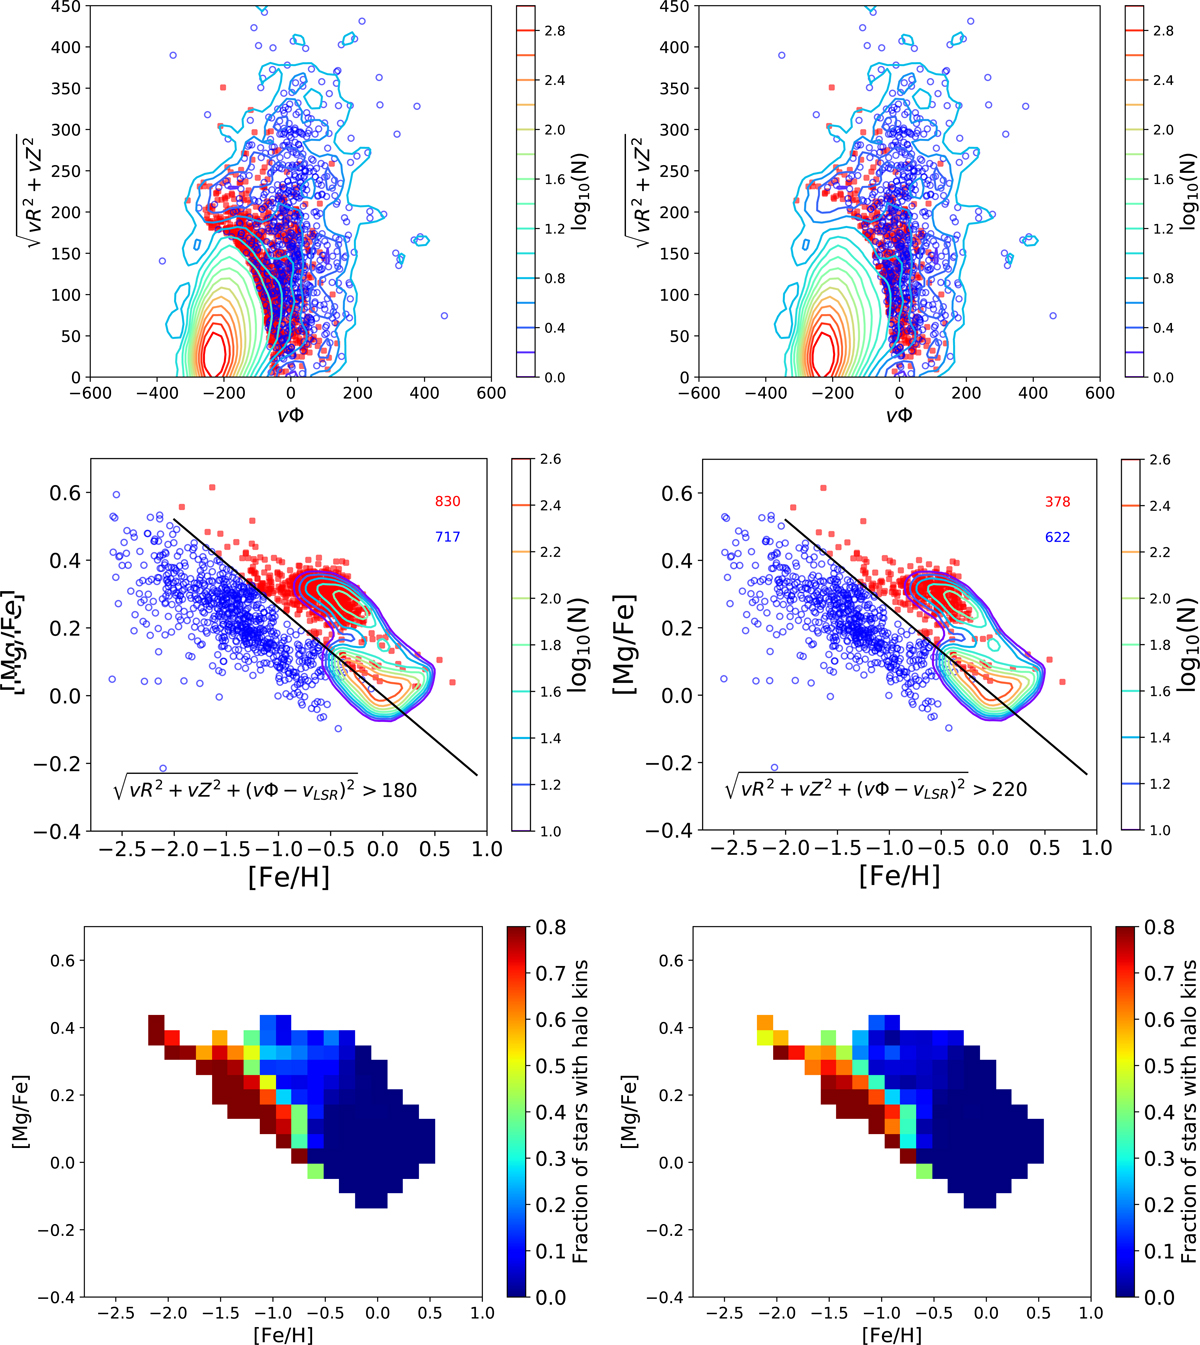
Fig. 18.

First row: Toomre diagram of all stars in our sample with halo-like kinematics. The distributions in the right and left panels differ for the threshold adopted in defining halo stars, as reported in the middle row. Red points indicate metal-rich thick-disc stars, blue points indicate accreted and metal-poor thick-disc stars (see middle row and text for their definition). Coloured lines correspond to isodensity contours for the whole sample analysed in this paper. Middle row: distribution, in the [Fe/H]–[Mg/Fe] plane, of stars of sample with halo-like kinematics. The diagonal line separates the metal-rich thick-disc sequence, in red on the right, from the accreted and metal-poor thick disc, in blue on the left. The distributions in the right and left panels differ for the threshold adopted in defining halo stars, as reported in the plots. The number of stars on the left and right of the diagonal lines are given in both panels, in blue and red, respectively. Coloured lines correspond to isodensity contours, as defined in Fig. 2. Bottom row: fraction of stars with halo-like kinematics, in [Fe/H]–[Mg/Fe] plane, for two different definitions of halo, adopted for left panels. In both plots, the fraction is normalised to the total number of stars in a given pixel.
Current usage metrics show cumulative count of Article Views (full-text article views including HTML views, PDF and ePub downloads, according to the available data) and Abstracts Views on Vision4Press platform.
Data correspond to usage on the plateform after 2015. The current usage metrics is available 48-96 hours after online publication and is updated daily on week days.
Initial download of the metrics may take a while.


