Fig. 14.
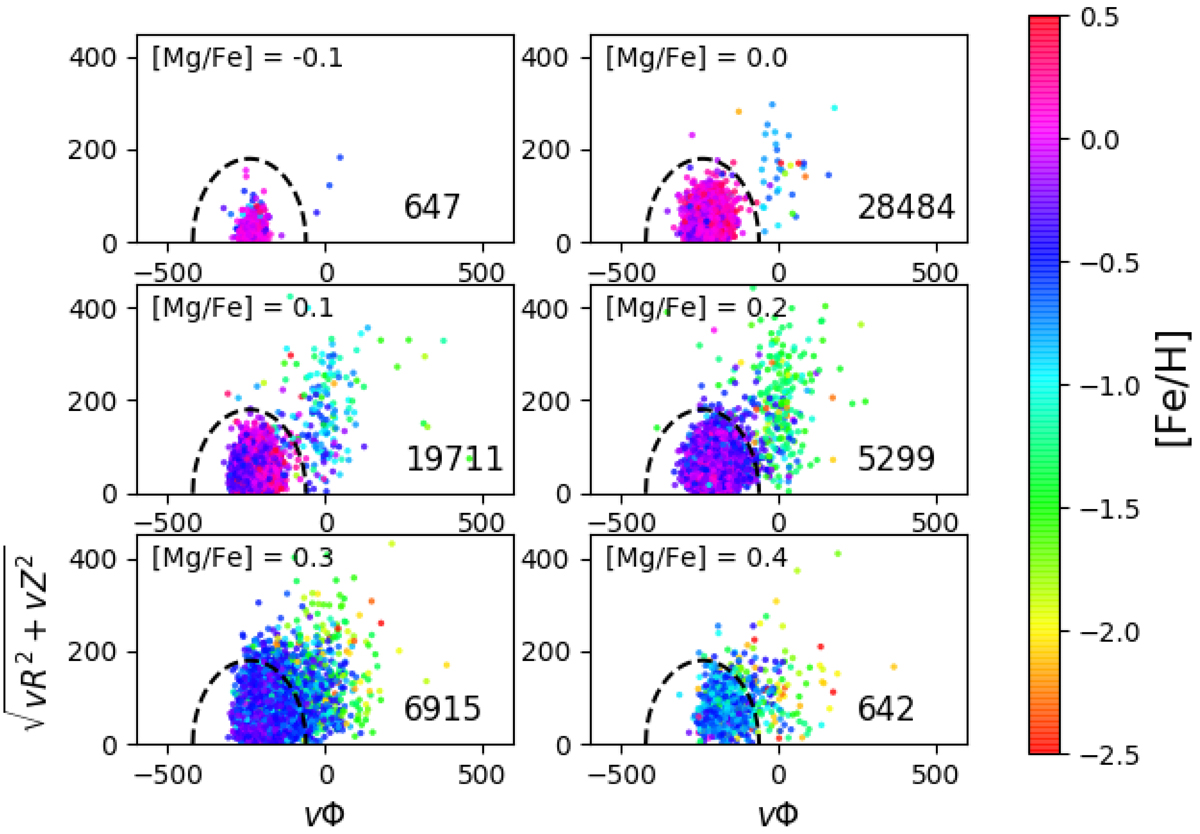
Distribution of sample stars in Toomre diagram, for different intervals of [Mg/Fe] abundances, as indicated at top left of each panel. [Mg/Fe] bins have been defined as in Fig. 4. The number of stars in each metallicity interval is given in the lower-right corner of each panel. The colour of each point indicates its [Fe/H] ratio as given in the colour bar shown to the right of the figure.
Current usage metrics show cumulative count of Article Views (full-text article views including HTML views, PDF and ePub downloads, according to the available data) and Abstracts Views on Vision4Press platform.
Data correspond to usage on the plateform after 2015. The current usage metrics is available 48-96 hours after online publication and is updated daily on week days.
Initial download of the metrics may take a while.