Fig. 7
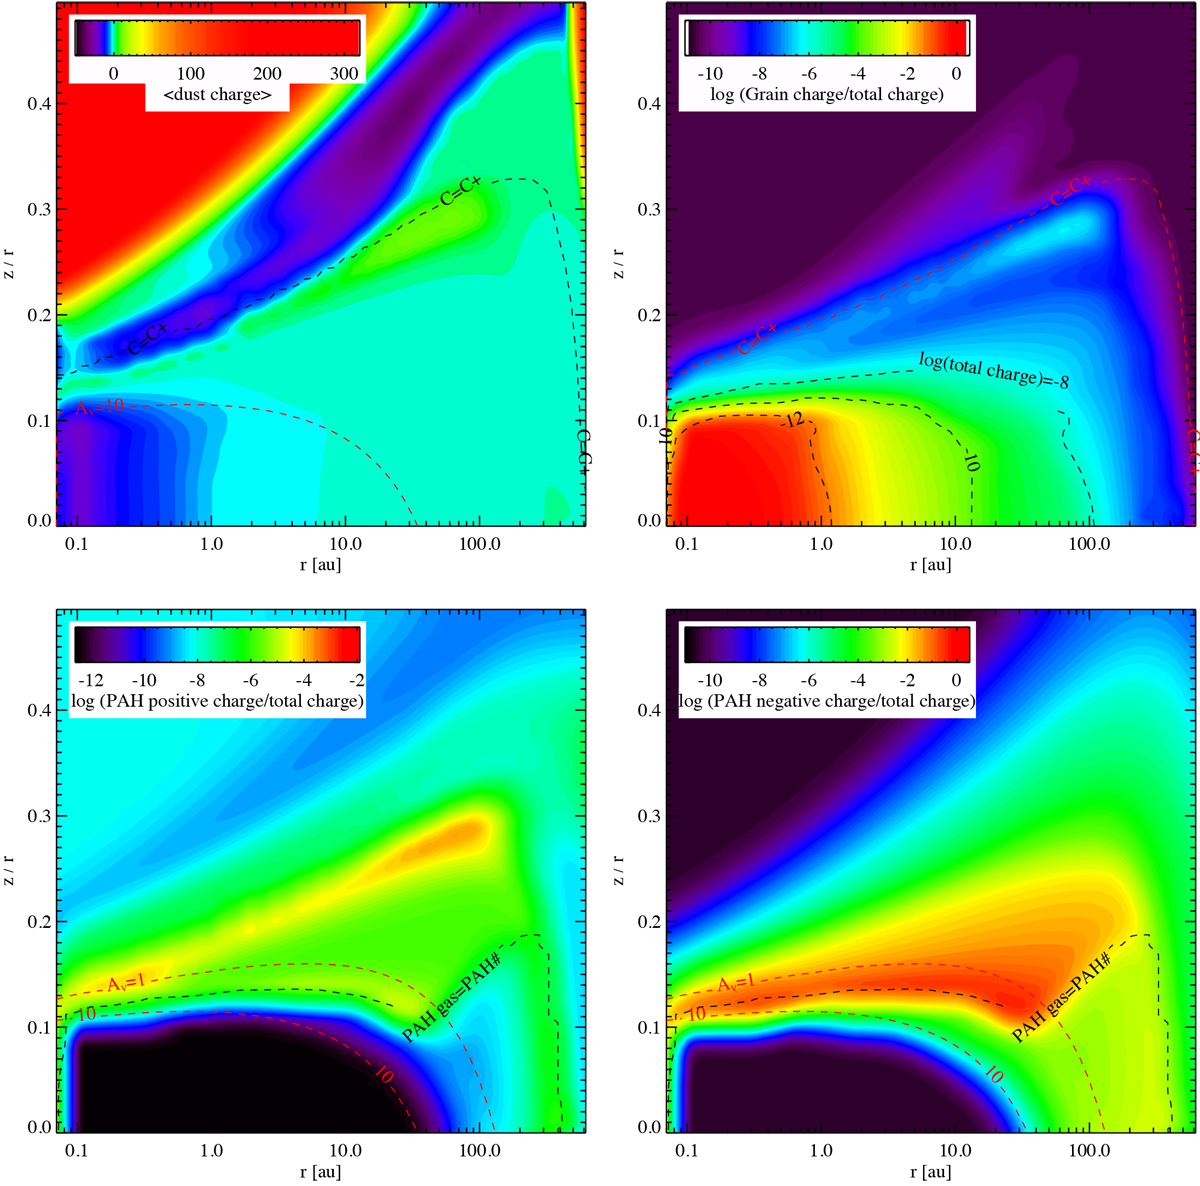
Average charge per grain (upper left) and its fractional contribution to the total charge (upper right). The location of the transition from ionized to neutral carbon is overplotted in the upper panels. The contribution of the positively charged PAHs (PAH+, PAH++, and PAH+++) is shown in the lower left panel, while the contribution of the negatively charged PAHs (PAH−) is shown in the lower right panel. The contours show the extinction and the location in the disk where the abundance of gas phase and frozen PAHs are equal. The model is the DIANA typical disk with βmid = 104. Silicate dust grains remains at Tdust < 1500 K at all disk heights (see Fig. F.1).
Current usage metrics show cumulative count of Article Views (full-text article views including HTML views, PDF and ePub downloads, according to the available data) and Abstracts Views on Vision4Press platform.
Data correspond to usage on the plateform after 2015. The current usage metrics is available 48-96 hours after online publication and is updated daily on week days.
Initial download of the metrics may take a while.