| Issue |
A&A
Volume 631, November 2019
|
|
|---|---|---|
| Article Number | A135 | |
| Number of page(s) | 5 | |
| Section | Stellar structure and evolution | |
| DOI | https://doi.org/10.1051/0004-6361/201936544 | |
| Published online | 06 November 2019 | |
Accretion disc by Roche lobe overflow in the supergiant fast X-ray transient IGR J08408−4503
1
Institut für Astronomie und Astrophysik, Kepler Center for Astro and Particle Physics, Eberhard Karls Universität, Sand 1, 72076 Tübingen, Germany
e-mail: This email address is being protected from spambots. You need JavaScript enabled to view it.
2
INAF – Osservatorio Astronomico di Brera, Via Bianchi 46, 23807 Merate, LC, Italy
Received:
21
August
2019
Accepted:
3
October
2019
Abstract
Supergiant fast X-ray transients (SFXTs) are X-ray binary systems with a supergiant companion and likely a neutron star, which show a fast (∼103 s) and high variability with a dynamic range up to 105−6. Given their extreme properties, they are considered among the most valuable laboratories to test accretion models. Recently, the orbital parameters of a member of this class, IGR J08408−4503, were obtained from optical observations. We used this information, together with X-ray observations from previous publications and new results from X-ray and optical data collected by INTEGRAL and presented in this work, to study the accretion mechanisms at work in IGR J08408−4503. We found that the high eccentricity of the compact object orbit and the large size of the donor star imply Roche lobe overflow (RLO) around the periastron. It is also likely that a fraction of the outer layers of the photosphere of the donor star are lost from the Lagrangian point L2 during the periastron passages. On the basis of these findings, we discuss the flaring variability of IGR J08408−4503 assuming the presence of an accretion disc. We point out that IGR J08408−4503 may not be the only SFXT with an accretion disc fueled by RLO. These findings open a new scenario for accretion mechanisms in SFXTs, since most of them have so far been based on the assumption of spherically symmetric accretion.
Key words: accretion / accretion disks / stars: neutron / X-rays: binaries / X-rays: individuals: IGR J08408−4503
© ESO 2019
1. Introduction
Supergiant fast X-ray transients (SFXTs) are a subclass of high mass X-ray binaries (HMXBs) composed of a compact object, that is a neutron star (NS) or black hole, accreting material from an OB supergiant star (for recent reviews, see Romano 2015 and Sidoli 2017). Classical HMXBs with a supergiant companion are X-ray sources with a typical X-ray luminosity of ∼1035−37 erg s−1 and moderate variability, which have a flux dynamic range of about ten. In contrast, SFXTs show sporadic X-ray outbursts with a duration of the order of about a day, composed of short (∼102 − 103 s) and bright (∼1035−38 erg s−1) flares. The low luminosity state is characterised by Llow ≈ 1032−33 erg s−1, and therefore the flux dynamic range can reach 105 − 106. These SFXTs show X-ray spectra reminiscent of those of accreting X-ray pulsars (power law with cut-off in the range 10−30 keV), indicating a likely NS nature for the compact object of the binary system. Several accretion mechanisms have been proposed to explain the X-ray variability of SFXTs. These mechanisms involve the accretion of wind clumps onto the NS (e.g. in’t Zand 2005; Ducci et al. 2009; Chaty 2013, and references therein), gating mechanisms (Grebenev & Sunyaev 2007; Bozzo et al. 2008), subsonic settling accretion regimes (e.g. Shakura et al. 2014), and formation of transient accretion discs (Ducci et al. 2010). IGR J08408−4503 has the lowest duty cycle among the SFXTs, with an activity duty cycle of 0.11% (according to the definition of Paizis & Sidoli 2014 based on INTEGRAL data) or, equivalently, highest inactivity duty cycle of  % (according to the definition1 of Romano et al. 2009a, 2014a based on Swift/X-Ray Telescope (XRT) data). IGR J08408−4503 was discovered on 2006 May 15 with the International Gamma-Ray Astronomy Laboratory (INTEGRAL; Götz et al. 2006). This system hosts a compact object orbiting around HD 74194, a O8.5 Ib-II(f)p supergiant (Sota et al. 2014), has an orbital period of P = 9.5436 ± 0.0002 d, and a high eccentricity of e = 0.63 ± 0.03 (Gamen et al. 2015).
Its distance from the Sun, derived from the parallax measurements in the Gaia Data Release 2, is  kpc (Bailer-Jones et al. 2018). IGR J08408−4503 shows, similarly to other SFXTs, sporadic X-ray outbursts composed by flares reaching X-ray luminosities of Lx ≈ 1036 erg s−1 (e.g. Romano et al. 2009b). During the quiescence, its X-ray luminosity is of the order of Lx ≈ 1032−33 erg s−1 (Sidoli et al. 2010; Bozzo et al. 2010). The X-ray spectrum in the energy range 0.5–50 keV during the flares can be described by an absorbed power law with high-energy cut-off and a black-body component (Sidoli et al. 2009; Romano et al. 2009b; Götz et al. 2007; Leyder et al. 2007). No cyclotron resonance scattering features have been detected at hard energies. In quiescence, the 0.3–10 keV spectrum is well described by a soft thermal plasma model and a hard power law, with two different absorptions, indicating that IGR J08408−4503 also accretes at low luminosity (Sidoli et al. 2010; Bozzo et al. 2010). Mechanisms involving accretion of inhomogeneous stellar winds (Romano et al. 2009b), and gating mechanisms (Götz et al. 2007; Bozzo et al. 2010) have been proposed for this source. In light of the orbital parameters recently derived by Gamen et al. (2015) from spectroscopic optical observations, we investigated the possible accretion mechanisms responsible for the X-ray variability exhibited by IGR J08408−4503. For this work we made use of INTEGRAL, Swift/Burst Alert Telescope (BAT), Monitor of All-sky X-ray Image (MAXI), Suzaku, and XMM-Newton data previously published (Götz et al. 2007; Leyder et al. 2007; Romano et al. 2009b; Sidoli et al. 2009, 2010; Bozzo et al. 2010) and of INTEGRAL data analysed in this work for the first time (Sect. 2). The results are discussed in Sect. 3.
2. Observations of IGR J08408−4503
2.1. Collection of previous X-ray observations
We calculated the orbital phases and the position along the orbit of all the bright flares (LX ≳ 1036 erg s−1) of IGR J08408−4503 observed since its discovery by Swift/BAT, INTEGRAL, and MAXI. For INTEGRAL, we also searched for previously unreported flares in all the archival data and we found one (see Sect. 2.2). In addition, we considered the long monitoring (about three days) performed by Suzaku, where IGR J08408−4503 was observed accreting at an X-ray luminosity of 1032 − 1033 erg s−1 (Sidoli et al. 2010), and an XMM-Newton observation where IGR J08408−4503 was caught at a similar low luminosity level (Bozzo et al. 2010). We assumed the orbital parameters derived by Gamen et al. (2015), and we also kept their assumption about the mass of the donor star, Md = 33 M⊙ (based on the calibration work of Martins et al. 2005) and their derivation for the mass of the NS, Mns = 1.61 M⊙. The times and orbital phases of these observations are shown in Table 1. The positions of these observations along the orbit are shown in Fig. 1.
Bright X-ray flares (Lx ≳ 1036 erg s−1) detected by INTEGRAL, Swift/BAT, MAXI, and long Suzaku and XMM-Newton observations of IGR J08408−4503 at lower luminosities.
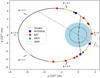 |
Fig. 1. Positions of the bright X-ray flares (LX ≳ 1036 erg s−1) and the Suzaku and XMM-Newton observations along the orbit of IGR J08408−4503. The blue circle shows the size of the donor star (Rd = 22 R⊙), the dotted circle shows the size of the Roche lobe at the periastron, and the dot-dashed line shows the fraction of the orbit around the periastron where the system is in RLO. |
2.2. Analysis of INTEGRAL data
We analysed all the available archival data collected by the INTEGRAL Soft Gamma-Ray Imager (ISGRI; Lebrun et al. 2003) detector of the Imager on Board INTEGRAL Satellite (IBIS; Ubertini et al. 2003) on board INTEGRAL (Winkler et al. 2003), from 2003 January 11 to 2019 February 17 (corresponding to 3222 pointings). The IBIS instrument operates in the ∼20 keV−10 MeV energy range. We performed the analysis using the Off-line Science Analysis (OSA) software provided by the ISDC Data Center for Astrophysics2. We only considered observations with IGR J08408−4503 within 12° from the centre of the IBIS/ISGRI field of view (FOV). In addition to the previously known flares, IGR J08408−4503 showed a bright flare in 2019 January 6 at 12:11:31.200 UTC (see Fig. 2, top panel). During the flare (Tstart = 58489.508 MJD; Tstop = 58489.541 MJD) the spectrum can be described by a a power law with high energy cut-off, with photon index of 2.5 ± 0.2,  keV,
keV,  keV (
keV ( = 1.36, 7 d.o.f.) Uncertainties are given at 68% confidence level. We added systematic uncertainties of 3% to the IBIS/ISGRI spectrum. The peak flux is ∼2.7 × 10⁻⁹ erg cm−2 s−1 (30−80 keV), corresponding to a luminosity of LX ≈ 1.6 × 1036 erg s−1 (Fig. 2, bottom panel). We searched for periodicities using IBIS/ISGRI data during the flare (i.e. we defined a good time interval with Tstart − Tstop defined above) by selecting events with pixel fraction illuminated by IGR J08408−4503 equal to one from the detector shadowgrams obtained before the reconstruction (deconvolution) of the sky image. In addition, we also performed this search using binned light curves (bin = 0.1 s) obtained with the OSA binning tool ii_light. In both cases the Solar System barycentre correction was applied. The search for periodic signals was performed in the range 0.01−1000 s with the event files and 0.2−1000 s with the binned light curve. We used the Z2 and the Lomb-Scargle periodogram techniques (Scargle 1982; Lomb 1976; Buccheri et al. 1983). No statistically significant periodicity was detected. During this flare, IGR J08408−4503 was outside of the JEM-X FOV. We estimated a 2σ upper limit to the pulsed fraction of 55% and 50% for periods in the ranges 0.2−10 s and 10−1000 s, respectively.
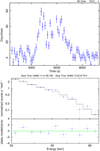 |
Fig. 2. Top panel: 30−50 keV light curve of the 2019 January flare of IGR J08408−4503. Bottom panel: IBIS/ISGRI spectrum of the flare of IGR J08408−4503. |
We performed an analysis of all the available photometric data of IGR J08408−4503 collected by the Optical Monitoring Camera (OMC; Mas-Hesse et al. 2003) on board INTEGRAL. This camera has a much smaller FOV compared to ISGRI (4.979 ° × 4.979°) and it is equipped with a Johnson V filter. We reduced the data following the prescriptions of the OMC Analysis User Manual3. Since IGR J08408−4503 is bright (V ≈ 7.5), we considered only the observations with integration time of 10 s because they allow a good measurement of the magnitude without pixel saturation. We thus selected 124 “good” observations of IGR J08408−4503. Figure 3 shows the light curve as a function of time (top panel) and folded with the orbital period of the source (bottom panel), where phase zero corresponds to the periastron passage. The OMC light curve presented here is, to the best of our knowledge, the most detailed and long photometric monitoring of this source. It shows irregular variability with amplitudes up to ∼0.14.
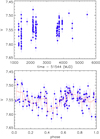 |
Fig. 3. Top panel: V band light curve of IGR J08408−4503, observed by the OMC. Bottom panel: same light curve, folded with the orbital period found by Gamen et al. (2015). Phase zero corresponds to the periastron passage. Blue points have a time duration of 10 s. Red line shows the binned light curve. The error bars of the red line are the standard deviation obtained from the magnitude values of the blue points and show their dispersion. |
3. Results and discussion
The bright X-ray flares of IGR J08408−4503 previously observed and the last flare detected by INTEGRAL and reported in this work are clustered around the periastron, within the orbital interval ∼0.84−0.14. The long Suzaku observation carried out during the same orbital phases of the flares shows a variable low luminosity state of ∼1032−33 erg s−1 (Sidoli et al. 2010), which implies a luminosity dynamic range of Γ = 103 − 104. Based on the calibration of O star parameters provided by Martins et al. (2005), we found that the average radius of the donor star of IGR J08408−4503, Rd ≈ 22 R⊙, is larger than the size of its Roche lobe at the periastron, Rl, d ≈ 14.4 R⊙, calculated with the formula provided by Eggleton (1983, Eq. (2)) assuming the stellar and orbital parameters previously adopted in this work (see Fig. 1, where the dotted circle shows the Rl, d at periastron). The dot-dashed line of Fig. 1 shows the fraction of the orbit where the system is in Roche lobe overflow (RLO; i.e. when Rd ≳ Rl, d). We obtained similar results using the calibration of O star parameters provided by Vacca et al. (1996), although in this case the radius of the donor star results to be larger than the periastron distance. The strong tidal interaction that would be caused by the periodic passage of the NS inside the photosphere of the companion star would likely produce a displacement of a significant fraction of the photosphere itself. Consequently, this would lead to a periodic optical luminosity and column density variability. In addition, the high mass accretion rate at ϕ = 0, where the NS would be inside the companion star, would cause a higher rate of X-ray flares at ϕ ≈ 0. Since none of these properties has been observed in IGR J08408−4503, this suggests that the radius of the donor star is likely to be smaller than the periastron distance. With the information about the visual magnitude measured by the OMC (mv = 7.55 ± 0.05), the distance ( kpc), the effective temperature (Teff = 32 274 ± 1800 K, Martins et al. 2005)4, the absorption (NH = 5.5 ± 0.4 × 1021 cm−2)5, and assuming that the radiation from the donor star is a black body, we found a radius of
  . Although it is not well constrained, we note that it is consistent with the values of Rd mentioned above for this type of stars, and thus consistent with the RLO hypothesis. Using the B and R magnitudes from the United States Naval Observatory B1 (USNO B1) catalogue (Monet et al. 2003) and the extinction law of Cardelli et al. (1989), we obtained
  . The larger uncertainty of this estimate is due to the worst photometric accuracy of the USNO B1 catalogue with respect to the OMC measurements.
Regös et al. (2005) studied the mass transfer in eccentric binaries in which RLO is expected to occur. They found that for high eccentricities (e ≥ 0.6), a high mass transfer at periastron is possible, and matter leaves the donor star through the Lagrangian points L1 and L2. A fraction of the matter leaving L2 falls back to the star, while the other part does not remain bound to the star. Similarly, part of the stream passing through L1 leaves the system, while most of it forms an accretion disc. Given the orbital parameters, this mechanism might be at work in IGR J08408−4503. The stream of matter lost by the donor star through L2 could make the environment around the binary system not “cleaned”: slow and denser regions of gas could be crossed by the NS along its orbit, feeding further the NS. In this scenario, the aperiodic optical variability shown by IGR J08408−4503 in the OMC light curve (Fig. 3) might be caused by sporadic absorption of dense clumps of gas lost from L1 and L2 crossing the line of sight, or by tidal interactions between the two stars, which disrupts the outer layers of the photosphere of HD 74194. As previously mentioned, another possible peculiarity of IGR J08408−4503 is the short distance between the NS and the surface of the donor star at periastron, that is just ≈6 × 1010 cm, assuming Rd = 22 R⊙ (the periastron distance is ∼22.9 R⊙). This would imply that there is likely not enough space for an accretion disc which, once formed during the orbital phases preceding ϕ ≈ 0, might be disrupted because of the tidal interactions with the donor star. A slightly smaller radius for the supergiant would increase the chances of survival of the disc; for example, if Rd ≈ 19 R⊙, i.e. the radius of HD 75211, a O8.5 II(f) star (Markova et al. 2018).
If the NS of IGR J08408−4503 is fed by an accretion disc, the high X-ray variability could be caused by transitions from inhibition of accretion (during low luminosity states) to the accretion regime (during flares). This would be possible for small variations of the mass rate gravitationally captured by the NS (Ṁc) if the corotation radius
![Mathematical equation: $$ \begin{aligned} r_{\rm co}=[GM_{\rm ns}P_{\rm spin}^2/(4\pi ^2)]^{1/3}, \end{aligned} $$](/articles/aa/full_html/2019/11/aa36544-19/aa36544-19-eq9.gif) (1)
(1)
defined as the distance from the NS where material in a Keplerian orbit corotates with the NS, is comparable in size to that of the inner radius of the disc; this is defined as the distance from the NS where the magnetic pressure and pressure exerted by the matter in the disc are balanced:
![Mathematical equation: $$ \begin{aligned} r_{\rm in} \approx \xi [\mu ^4/(GM_{\rm ns}\dot{M}_{\rm c}^2)]^{1/7}. \end{aligned} $$](/articles/aa/full_html/2019/11/aa36544-19/aa36544-19-eq10.gif) (2)
(2)
In these equations, Mns is the mass of the NS and Pspin its spin period, ξ ≈ 0.4 in case of accretion from a Keplerian disc or 1 in case of spherical accretion (see Revnivtsev & Mereghetti 2015 and references therein), μ is the magnetic dipole moment,  is the magnetic field strength at the poles, and Rns is the radius of the NS.
If rin > rco, the centrifugal barrier sets in. During this stage the accretion is expected to be negligible. Once rin ≈ rco, the centrifugal barrier is overcome and accretion sets in. In this framework, we can consider the following very simplified calculations. We assume that during the accretion state the X-ray luminosity is given by Lacc ≈ GMnsṀc/Rns. When the magnetic barrier activates (rin = rco) for small variations of Ṁc, which for simplicity can be considered constant in our calculations, this value reduces to Lgate ≈ GMnsṀc/rco. Therefore, rco can be expressed as a function of Γ = Lacc/Lgate,
 (3)
(3)
Assuming again rin = rco, from Eqs. (2) and (3), we obtain the following relation between μ, Lacc, and Γ:
 (4)
(4)
Assuming Γ = 103 − 104, Lacc = 1036 erg s−1, Rns = 12 km, Mns = 1.61 M⊙, and ξ = 0.4, we find μ = 1.1 × 1031 − 6.2 × 1032 G cm3 and thence B = 1.3 × 10¹³ − 7.2 × 10¹⁴ G. From Eq. (1) we then obtain Pspin = 18−570 s, while the corotation radius is rco = 1.2 × 10⁹ − 1.2 × 1010 cm. These calculations indicate a magnetar nature for the compact object of IGR J08408−4503 for a wide range of values of Γ. The lack of clear signatures for the presence of an accretion disc in the X-ray spectrum of IGR J08408−4503 in the spectral analyses presented in previous works is in agreement with the high magnetic field and low spin period inferred from the calculations presented above. If rin = rco, from the equation of the spectrum emitted by an optically thick accretion disc (e.g. Frank et al. 2002, Eq. (5.43)),
![Mathematical equation: $$ \begin{aligned} T(r) = \left[ \frac{3 G M \dot{M}_{\rm c}}{8 \pi r^3 \sigma } \left( 1 - \sqrt{\frac{R_{\rm ns}}{r}} \right) \right]^{1/4}, \end{aligned} $$](/articles/aa/full_html/2019/11/aa36544-19/aa36544-19-eq14.gif)
where σ is the Stefan-Boltzmann constant, we obtain T(rin)∼1 eV, which means that an accretion disc would be too cold to be observed in X-ray.
A possible problem for the accretion disc scenario is that the bright flares (Lx ≳ 1036 erg s−1) are clustered in an interval of the orbit around the periastron (Δϕ ≈ 0.3). We expect a higher mass accretion rate in this interval of the orbit because of RLO and because the stellar wind is denser and slower closer to the donor star. However if the accretion is mediated by a disc, the NS would feel effects of the mass accretion rate variability with a time delay, which is of the order of the viscous timescale (∼ days; for IGR J08408−4503) and not necessarily in phase with the orbital period. One possibility previously mentioned is that the size of the donor star is so large that the accretion disc is disrupted by tidal interactions at ϕ ≈ 0. In this case, the accretion is spherically symmetric along the orbit – no delay effects are expected – and the gating mechanism model of Bozzo et al. (2008) can be applied. In this framework, the denser streams of gas expelled by the donor star from L2 and L1, and sporadically accreted by the NS during the periastron passages, could trigger the transitions from low to higher luminosity accretion regimes described in Bozzo et al. (2008). Instead, if the size of the donor star is such that the accretion disc survives at ϕ ≈ 0, a two-stream accretion mechanism similar to that proposed by Lipunov (1980, 1982) could be in operation. During RLO, an accretion disc forms. In addition, the NS accretes from the strong stellar wind produced by the companion star all along the orbit. Lipunov (1982) pointed out that during the propeller state, which could be the low luminosity state of IGR J08408−4503, the spherical stream collides with the magnetosphere and slowly settles down on the NS equatorial plane to form or feed an already existing accretion disc. In this case, the clustering of the bright flares around the periastron might be caused by the sudden overcoming of the centrifugal barrier (rin ≲ rco) triggered by instabilities produced by the enhanced accretion produced by the spherical stream around the periastron. The interactions between the two accretion streams are still poorly studied. Mustsevoi & Khoperskov (1991) pointed out that they could lead to instabilities in the accretion disc.
IGR J08408−4503 could not be an isolated case of accretion through RLO among SFXTs. To the best of our knowledge there are at least two other cases: IGR J16418−4532 and IGR J16479−4514. Their orbital, stellar, and Roche lobe properties are reported in Table 2. While for reasonable values of the radius, the donor star of IGR J16479−4514 could still underfill its Roche lobe (as pointed out by Sidoli et al. 2013), for IGR J16418−4532 the radius of the donor star is clearly too large compared to its Roche lobe (see Sidoli et al. 2012 and Drave et al. 2013, for further discussions). In particular, we note that with the parameters reported in Table 2, the radius of the donor star of IGR J16418−4532 would be slightly larger than the orbital size, which is obviously not possible. According to Crowther et al. (2006), the radii of B 0.5Ia stars can be significantly different between different stars. Although on average they are ∼33−34 R⊙, for example another star of similar spectral type, κ Ori, has R* ≈ 22.2 R⊙, which would still imply R* ≳ Rl, d for IGR J16418−4532.
List of SFXTs which might experience RLO in a fraction or along the entire NS orbit.
The formation of accretion discs through RLO could therefore be a property common to a group of SFXTs. This hypothesis, however, requires further investigation. Therefore, in-depth optical observations and X-ray studies aimed at determining more precisely the masses and radii of the SFXTs reported in Table 2 and the presence of an accretion disc are of fundamental importance.
The duty cycle of inactivity is the time each source spends undetected down to a flux limit of 1–3 × 10⁻¹² erg cm−2 s−1, the limiting flux for a 1 ks XRT exposure.
OSA v. 11 for data collected after INTEGRAL revolution 1626: https://www.isdc.unige.ch/integral/download/osa/doc/11.0/osa_um_ibis/man.html , and OSA v. 10.2 otherwise: https://www.isdc.unige.ch/integral/download/osa/doc/10.2/osa_um_ibis/man.html
The error on Teff is a rough estimate obtained by the values in Tables 3 and 6 of Martins et al. (2005).
Obtained from the XMM-Newton observations of IGR J08408−4503 during the low luminosity state and reported in Sidoli et al. (2013). We only considered the absorption affecting the MEKAL (Mewe-Kaastra-Liedahl) component to exclude the absorption produced around the accreting compact object. The column density is obtained from the weighted mean of the values reported in Table 3 of Sidoli et al. (2013), with uncertainties corrected to 1σ confidence level. We converted NH to AV using the formula presented in Güver & Özel (2009) and taking into account the uncertainties reported in their paper.
Acknowledgments
We thank the anonymous referee for constructive comments that helped to improve the paper. This paper is based on data from observations with INTEGRAL satellite, an ESA project with instruments and science data centre funded by ESA member states (especially the PI countries: Denmark, France, Germany, Italy, Spain, and Switzerland), Czech Republic and Poland, and with the participation of Russia and the USA. This work is supported by the Bundesministerium für Wirtschaft und Technologie through the Deutsches Zentrum für Luft und Raumfahrt (grant FKZ 50 OG 1602). P. R. acknowledges contract ASI-INAF I/004/11/0. We acknowledge financial contribution from the agreement ASI-INAF n.2017-14-H.O.
References
- Bailer-Jones, C. A. L., Rybizki, J., Fouesneau, M., Mantelet, G., & Andrae, R. 2018, AJ, 156, 58 [NASA ADS] [CrossRef] [Google Scholar]
- Bozzo, E., Falanga, M., & Stella, L. 2008, ApJ, 683, 1031 [NASA ADS] [CrossRef] [Google Scholar]
- Bozzo, E., Stella, L., Ferrigno, C., et al. 2010, A&A, 519, A6 [NASA ADS] [CrossRef] [EDP Sciences] [Google Scholar]
- Buccheri, R., Bennett, K., Bignami, G. F., et al. 1983, A&A, 128, 245 [NASA ADS] [Google Scholar]
- Cardelli, J. A., Clayton, G. C., & Mathis, J. S. 1989, ApJ, 345, 245 [NASA ADS] [CrossRef] [Google Scholar]
- Chaty, S. 2013, AdSpR, 52, 2132 [Google Scholar]
- Coleiro, A., Chaty, S., Zurita Heras, J. A., Rahoui, F., & Tomsick, J. A. 2013, A&A, 560, A108 [NASA ADS] [CrossRef] [EDP Sciences] [Google Scholar]
- Crowther, P. A., Lennon, D. J., & Walborn, N. R. 2006, A&A, 446, 279 [NASA ADS] [CrossRef] [EDP Sciences] [Google Scholar]
- Drave, S. P., Bird, A. J., Sidoli, L., et al. 2013, MNRAS, 433, 528 [NASA ADS] [CrossRef] [Google Scholar]
- Ducci, L., Sidoli, L., Mereghetti, S., Paizis, A., & Romano, P. 2009, MNRAS, 398, 2152 [NASA ADS] [CrossRef] [Google Scholar]
- Ducci, L., Sidoli, L., & Paizis, A. 2010, MNRAS, 408, 1540 [NASA ADS] [CrossRef] [Google Scholar]
- Eggleton, P. P. 1983, ApJ, 268, 368 [NASA ADS] [CrossRef] [Google Scholar]
- Frank, J., King, A., & Raine, D. J. 2002, Accretion Power in Astrophysics, 3rd edn. (Cambridge: Cambridge University Press) [Google Scholar]
- Gamen, R., Barbà, R. H., Walborn, N. R., et al. 2015, A&A, 583, L4 [NASA ADS] [CrossRef] [EDP Sciences] [Google Scholar]
- Götz, D., Schanne, S., Rodriguez, J., et al. 2006, ATel, 813, 1 [NASA ADS] [Google Scholar]
- Götz, D., Falanga, M., Senziani, F., et al. 2007, ApJ, 655, L101 [NASA ADS] [CrossRef] [Google Scholar]
- Grebenev, S. A., & Sunyaev, R. A. 2007, Astron. Lett., 33, 149 [NASA ADS] [CrossRef] [Google Scholar]
- Güver, T., & Özel, F. 2009, MNRAS, 400, 2050 [NASA ADS] [CrossRef] [Google Scholar]
- in’t Zand, J. J. M. 2005, A&A, 441, L1 [NASA ADS] [CrossRef] [EDP Sciences] [Google Scholar]
- Jain, C., Paul, B., & Dutta, A. 2009, MNRAS, 397, L11 [NASA ADS] [CrossRef] [Google Scholar]
- Lebrun, F., Leray, J. P., Lavocat, P., et al. 2003, A&A, 411, L141 [NASA ADS] [CrossRef] [EDP Sciences] [Google Scholar]
- Levine, A. M., Bradt, H. V., Chakrabarty, D., Corbet, R. H. D., & Harris, R. J. 2011, ApJS, 196, 6 [NASA ADS] [CrossRef] [Google Scholar]
- Leyder, J. C., Walter, R., Lazos, M., Masetti, N., & Produit, N. 2007, A&A, 465, L35 [NASA ADS] [CrossRef] [EDP Sciences] [Google Scholar]
- Lipunov, V. M. 1980, AZh, 57, 1253 [NASA ADS] [Google Scholar]
- Lipunov, V. M. 1982, Ap&SS, 82, 343 [NASA ADS] [CrossRef] [Google Scholar]
- Lomb, N. R. 1976, Ap&SS, 39, 447 [NASA ADS] [CrossRef] [Google Scholar]
- Markova, N., Puls, J., & Langer, N. 2018, A&A, 613, A12 [NASA ADS] [CrossRef] [EDP Sciences] [Google Scholar]
- Martins, F., Schaerer, D., & Hillier, D. J. 2005, A&A, 436, 1049 [NASA ADS] [CrossRef] [EDP Sciences] [Google Scholar]
- Mas-Hesse, J. M., Giménez, A., Culhane, J. L., et al. 2003, A&A, 411, L261 [NASA ADS] [CrossRef] [EDP Sciences] [Google Scholar]
- Monet, D. G., Levine, S. E., Canzian, B., et al. 2003, AJ, 125, 984 [NASA ADS] [CrossRef] [Google Scholar]
- Mustsevoi, V. V., & Khoperskov, A. V. 1991, Sov. Astron. Lett., 17, 119 [NASA ADS] [Google Scholar]
- Nespoli, E., Fabregat, J., & Mennickent, R. E. 2008, A&A, 486, 911 [NASA ADS] [CrossRef] [EDP Sciences] [Google Scholar]
- Paizis, A., & Sidoli, L. 2014, MNRAS, 439, 3439 [NASA ADS] [CrossRef] [Google Scholar]
- Regös, E., Bailey, V. C., & Mardling, R. 2005, MNRAS, 358, 544 [NASA ADS] [CrossRef] [Google Scholar]
- Revnivtsev, M., & Mereghetti, S. 2015, Space Sci. Rev., 191, 293 [NASA ADS] [CrossRef] [Google Scholar]
- Romano, P. 2015, J. High Energy Astrophys., 7, 126 [NASA ADS] [CrossRef] [Google Scholar]
- Romano, P., Sidoli, L., Cusumano, G., et al. 2009a, MNRAS, 399, 2021 [NASA ADS] [CrossRef] [Google Scholar]
- Romano, P., Sidoli, L., Cusumano, G., et al. 2009b, MNRAS, 392, 45 [NASA ADS] [CrossRef] [Google Scholar]
- Romano, P., Lien, A. Y., Evans, P. A., et al. 2013, ATel, 5190, 1 [NASA ADS] [Google Scholar]
- Romano, P., Guidorzi, C., Segreto, A., Ducci, L., & Vercellone, S. 2014a, A&A, 572, A97 [NASA ADS] [CrossRef] [EDP Sciences] [Google Scholar]
- Romano, P., Krimm, H. A., Palmer, D. M., et al. 2014b, A&A, 562, A2 [NASA ADS] [CrossRef] [EDP Sciences] [Google Scholar]
- Scargle, J. D. 1982, ApJ, 263, 835 [NASA ADS] [CrossRef] [Google Scholar]
- Searle, S. C., Prinja, R. K., Massa, D., & Ryans, R. 2008, A&A, 481, 777 [NASA ADS] [CrossRef] [EDP Sciences] [Google Scholar]
- Shakura, N., Postnov, K., Sidoli, L., & Paizis, A. 2014, MNRAS, 442, 2325 [NASA ADS] [CrossRef] [Google Scholar]
- Sidoli, L. 2017, Proceedings of the XII Multifrequency Behaviour of High Energy Cosmic Sources Workshop. 12–17 June, 52 [Google Scholar]
- Sidoli, L., Romano, P., Ducci, L., et al. 2009, MNRAS, 397, 1528 [NASA ADS] [CrossRef] [Google Scholar]
- Sidoli, L., Esposito, P., & Ducci, L. 2010, MNRAS, 409, 611 [NASA ADS] [CrossRef] [Google Scholar]
- Sidoli, L., Mereghetti, S., Sguera, V., & Pizzolato, F. 2012, MNRAS, 420, 554 [NASA ADS] [CrossRef] [Google Scholar]
- Sidoli, L., Esposito, P., Sguera, V., et al. 2013, MNRAS, 429, 2763 [NASA ADS] [CrossRef] [Google Scholar]
- Sota, A., Maíz Apellániz, J., Morrell, N. I., et al. 2014, ApJS, 211, 10 [NASA ADS] [CrossRef] [Google Scholar]
- Ubertini, P., Lebrun, F., Di Cocco, G., et al. 2003, A&A, 411, L131 [NASA ADS] [CrossRef] [EDP Sciences] [Google Scholar]
- Vacca, W. D., Garmany, C. D., & Shull, J. M. 1996, ApJ, 460, 914 [NASA ADS] [CrossRef] [Google Scholar]
- Winkler, C., Courvoisier, T. J. L., Di Cocco, G., et al. 2003, A&A, 411, L1 [NASA ADS] [CrossRef] [EDP Sciences] [Google Scholar]
All Tables
Bright X-ray flares (Lx ≳ 1036 erg s−1) detected by INTEGRAL, Swift/BAT, MAXI, and long Suzaku and XMM-Newton observations of IGR J08408−4503 at lower luminosities.
List of SFXTs which might experience RLO in a fraction or along the entire NS orbit.
All Figures
|
Fig. 1. Positions of the bright X-ray flares (LX ≳ 1036 erg s−1) and the Suzaku and XMM-Newton observations along the orbit of IGR J08408−4503. The blue circle shows the size of the donor star (Rd = 22 R⊙), the dotted circle shows the size of the Roche lobe at the periastron, and the dot-dashed line shows the fraction of the orbit around the periastron where the system is in RLO. |
| In the text | |
|
Fig. 2. Top panel: 30−50 keV light curve of the 2019 January flare of IGR J08408−4503. Bottom panel: IBIS/ISGRI spectrum of the flare of IGR J08408−4503. |
| In the text | |
|
Fig. 3. Top panel: V band light curve of IGR J08408−4503, observed by the OMC. Bottom panel: same light curve, folded with the orbital period found by Gamen et al. (2015). Phase zero corresponds to the periastron passage. Blue points have a time duration of 10 s. Red line shows the binned light curve. The error bars of the red line are the standard deviation obtained from the magnitude values of the blue points and show their dispersion. |
| In the text | |
Current usage metrics show cumulative count of Article Views (full-text article views including HTML views, PDF and ePub downloads, according to the available data) and Abstracts Views on Vision4Press platform.
Data correspond to usage on the plateform after 2015. The current usage metrics is available 48-96 hours after online publication and is updated daily on week days.
Initial download of the metrics may take a while.