Fig. 3.
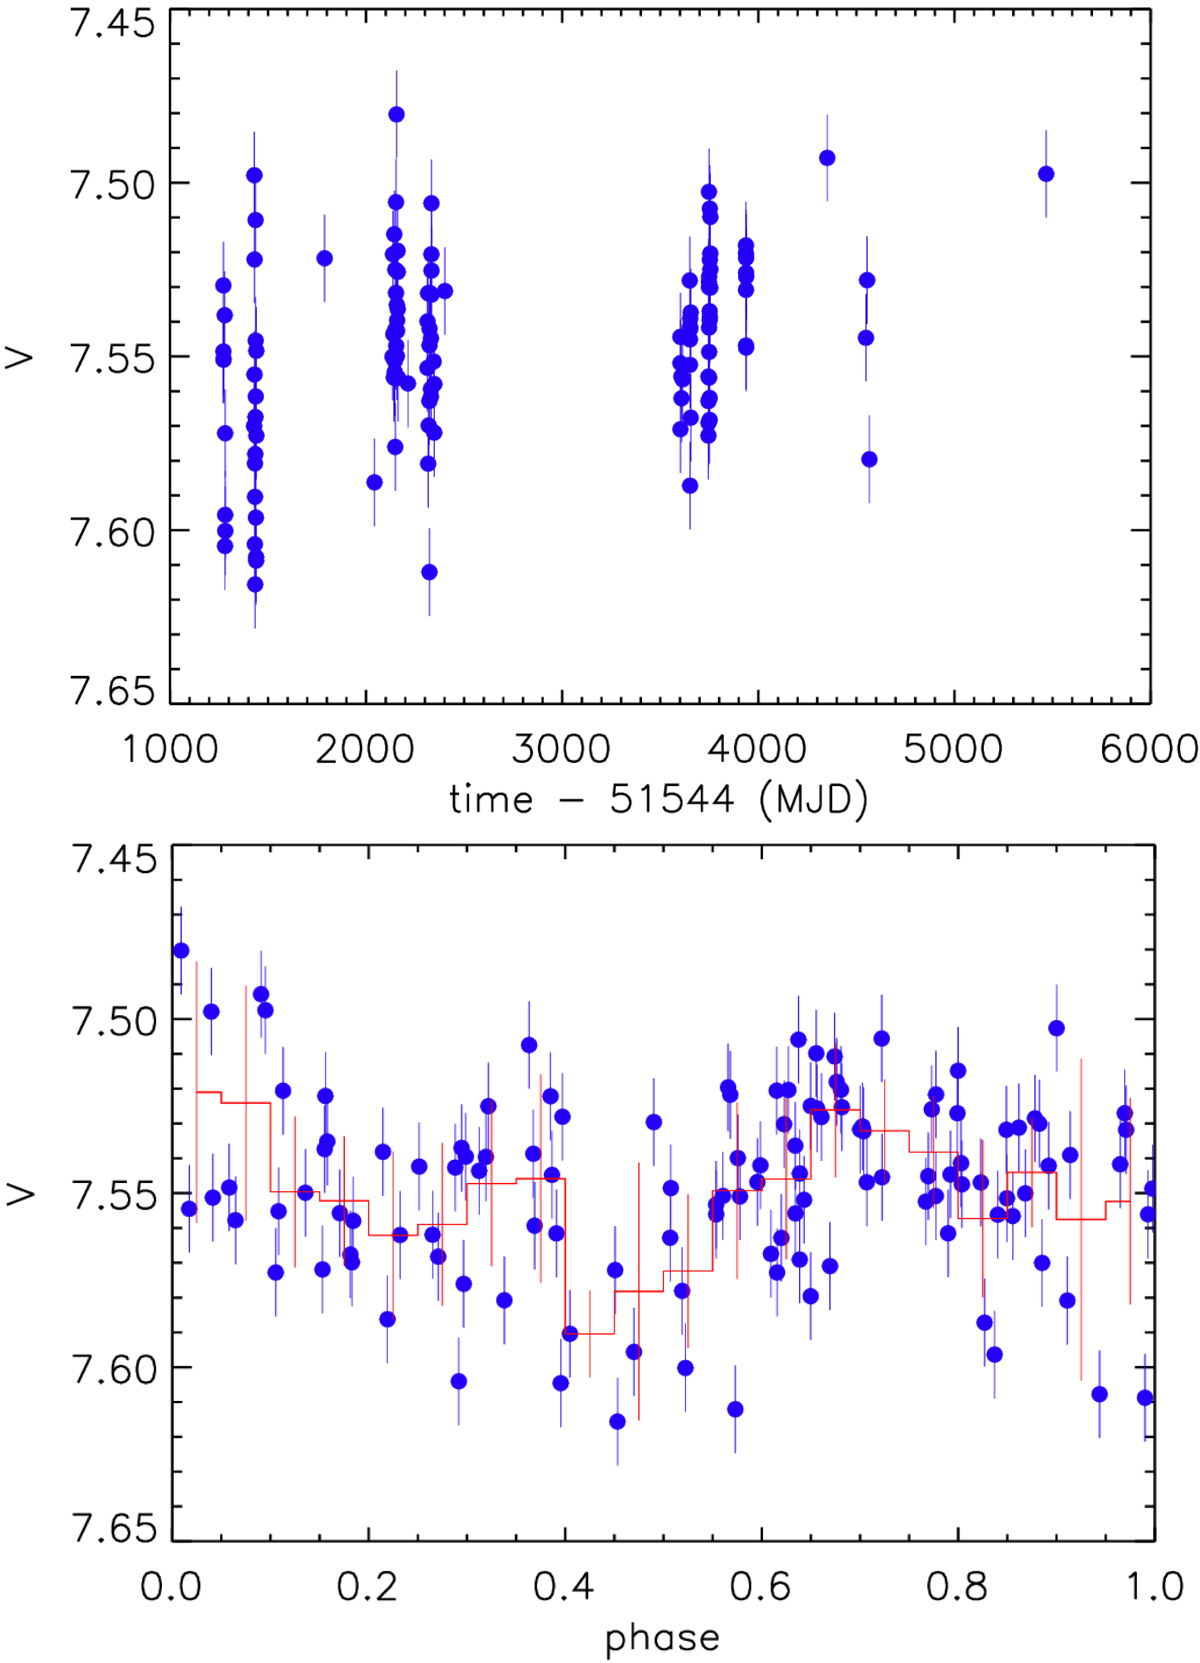
Top panel: V band light curve of IGR J08408−4503, observed by the OMC. Bottom panel: same light curve, folded with the orbital period found by Gamen et al. (2015). Phase zero corresponds to the periastron passage. Blue points have a time duration of 10 s. Red line shows the binned light curve. The error bars of the red line are the standard deviation obtained from the magnitude values of the blue points and show their dispersion.
Current usage metrics show cumulative count of Article Views (full-text article views including HTML views, PDF and ePub downloads, according to the available data) and Abstracts Views on Vision4Press platform.
Data correspond to usage on the plateform after 2015. The current usage metrics is available 48-96 hours after online publication and is updated daily on week days.
Initial download of the metrics may take a while.