Free Access
Fig. 2.
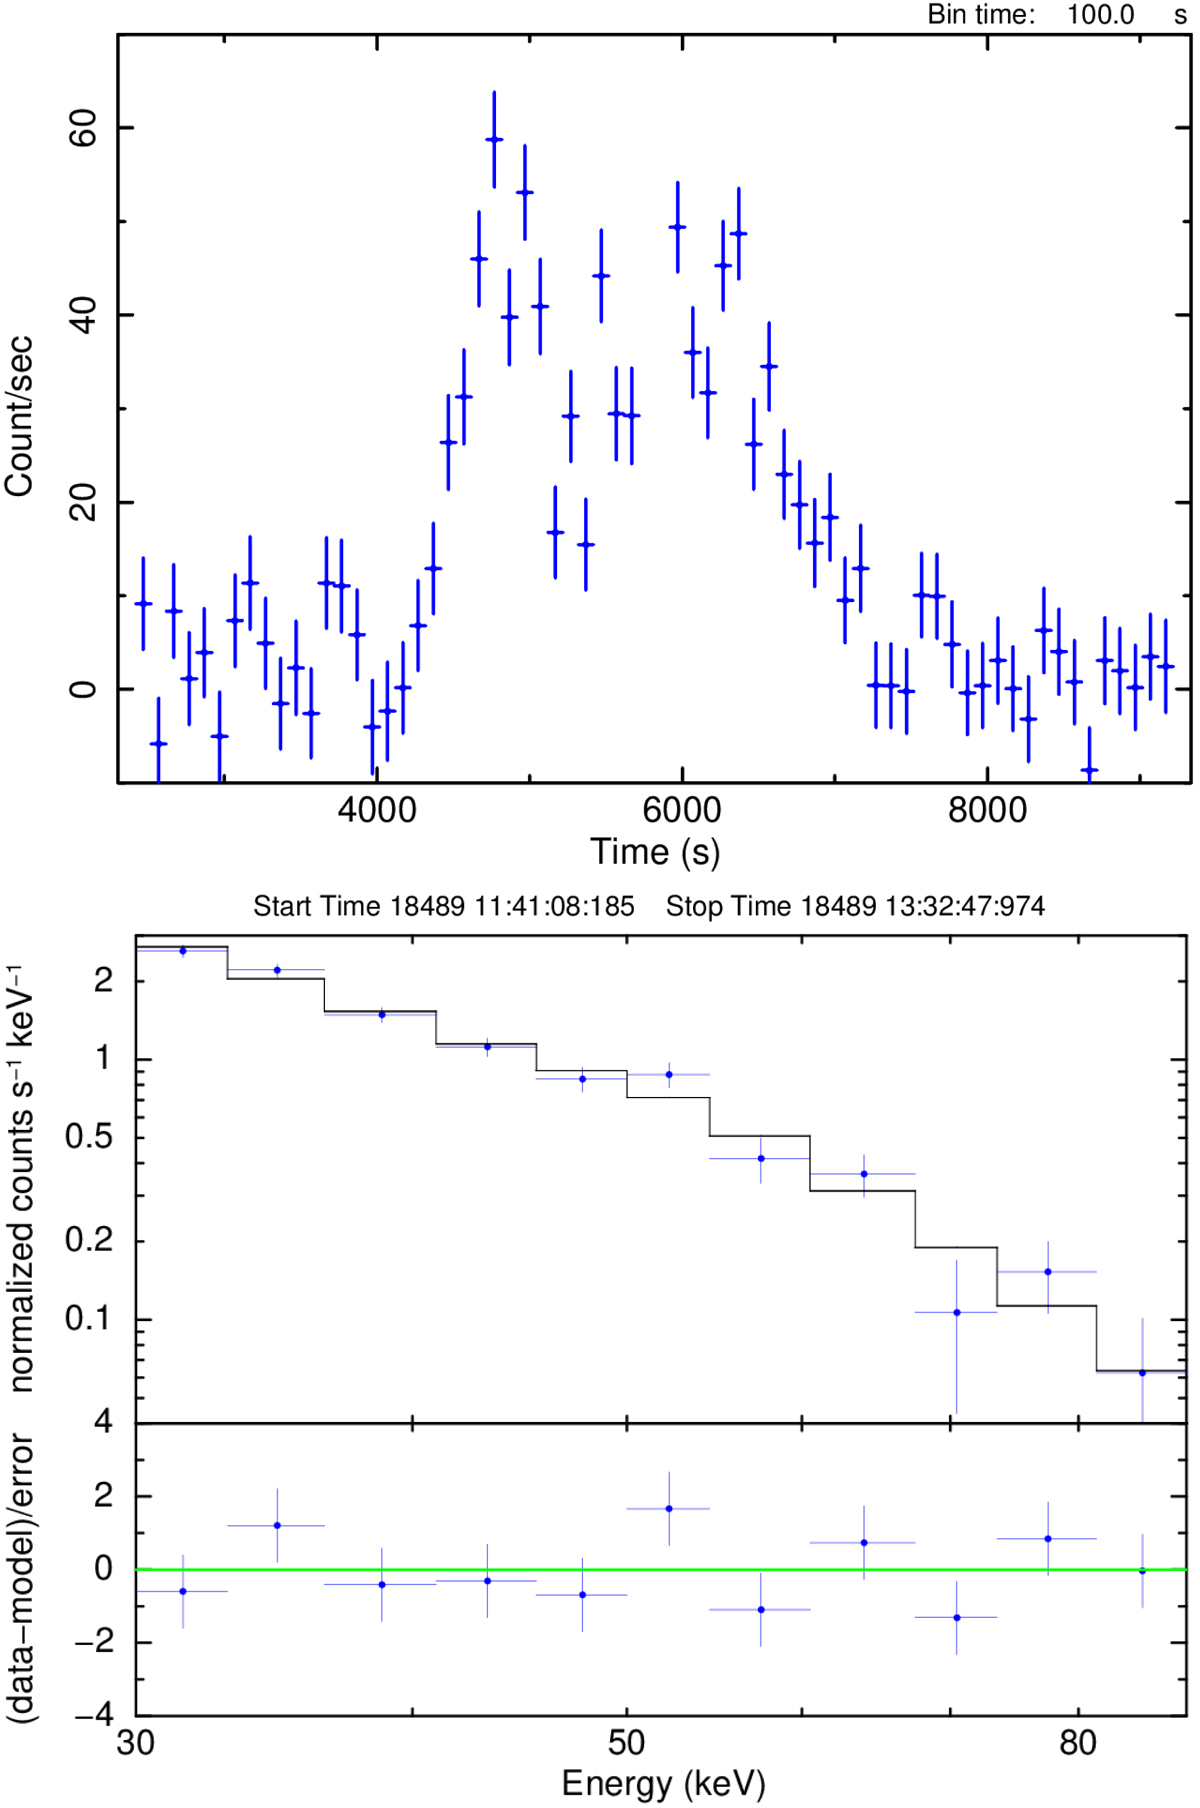
Top panel: 30−50 keV light curve of the 2019 January flare of IGR J08408−4503. Bottom panel: IBIS/ISGRI spectrum of the flare of IGR J08408−4503.
Current usage metrics show cumulative count of Article Views (full-text article views including HTML views, PDF and ePub downloads, according to the available data) and Abstracts Views on Vision4Press platform.
Data correspond to usage on the plateform after 2015. The current usage metrics is available 48-96 hours after online publication and is updated daily on week days.
Initial download of the metrics may take a while.