Fig. 5.
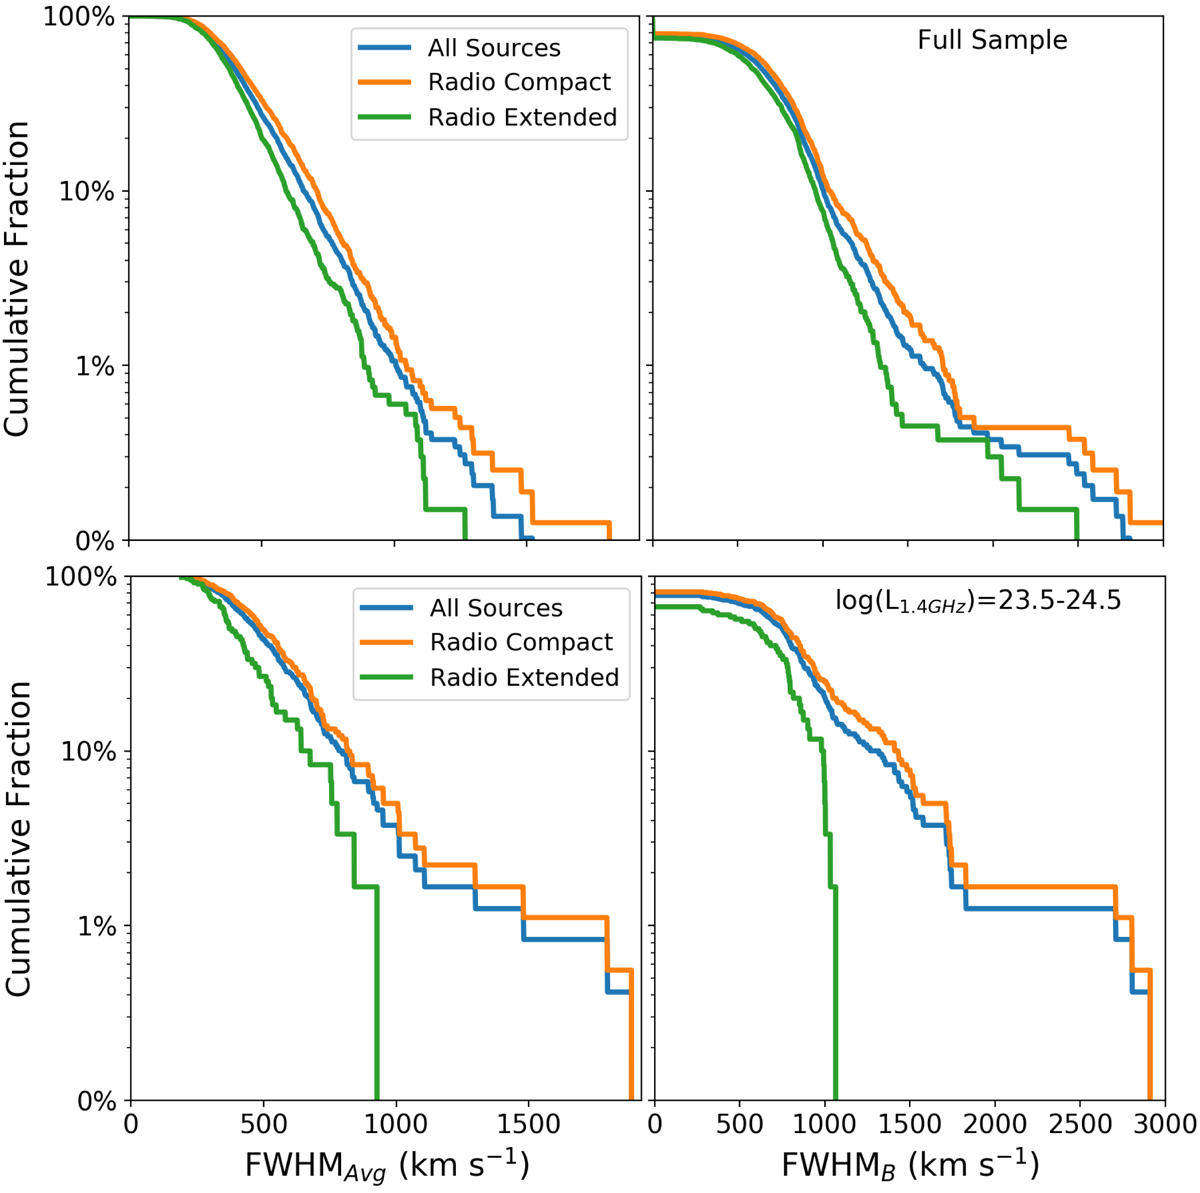
Fraction of AGN with [O III] FWHM greater than a given value for FWHMAvg (left two panels) and FWHMB (right two panels). Top two panels: full sample of this work, and the bottom two panels show the subset with radio luminosities of log[L1.4 GHz/W Hz−1] = 23.5−24.5. The cumulative distributions are shown for all the sources in each bin (blue curves) and split by our classifications of compact and extended radio sources (orange and green curves, respectively). Extreme ionised gas velocities are more prevalent when the radio emission is compact; e.g., components with FWHMB > 1000 km s−1 are four times as likely in compact sources in the log[L1.4 GHz/W Hz−1] = 23.5−24.5 sample (bottom right panel).
Current usage metrics show cumulative count of Article Views (full-text article views including HTML views, PDF and ePub downloads, according to the available data) and Abstracts Views on Vision4Press platform.
Data correspond to usage on the plateform after 2015. The current usage metrics is available 48-96 hours after online publication and is updated daily on week days.
Initial download of the metrics may take a while.