Fig. 3.
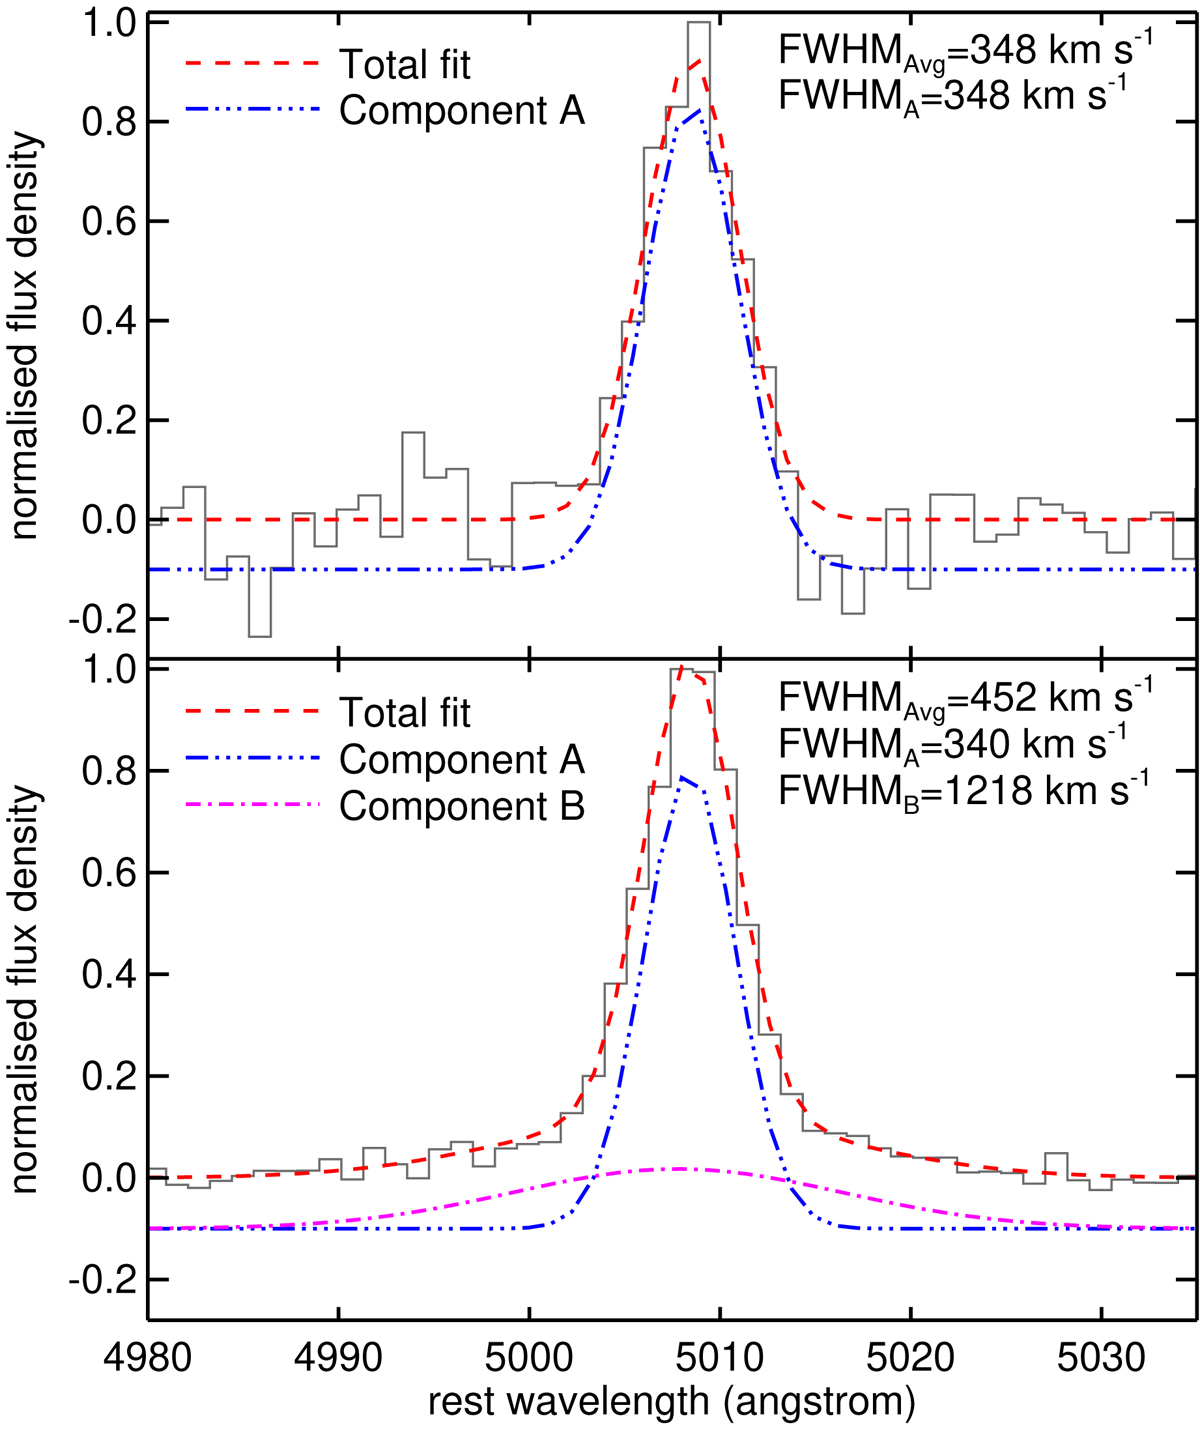
[O III]λ5007 emission-line profiles (grey curves) and their fits (dashed curves) for an example with a single component (upper panel) and an example with two components (lower panel). The individual components A and B are shown as dot-dashed and three-dot-dashed curves, respectively, artificially offset by −0.1 in the y-axis. We considered both the velocity widths of any identified broad components (FWHMB) and the flux-weighted average line widths of all identified components (FWHMAvg) here.
Current usage metrics show cumulative count of Article Views (full-text article views including HTML views, PDF and ePub downloads, according to the available data) and Abstracts Views on Vision4Press platform.
Data correspond to usage on the plateform after 2015. The current usage metrics is available 48-96 hours after online publication and is updated daily on week days.
Initial download of the metrics may take a while.