| Issue |
A&A
Volume 631, November 2019
|
|
|---|---|---|
| Article Number | A49 | |
| Number of page(s) | 8 | |
| Section | Extragalactic astronomy | |
| DOI | https://doi.org/10.1051/0004-6361/201936164 | |
| Published online | 17 October 2019 | |
LOFAR measures the hotspot advance speed of the high-redshift blazar S5 0836+710⋆
1
Institut für Theoretische Physik und Astrophysik, Universität Würzburg, Emil-Fischer-Straße 31, 97074 Würzburg, Germany
e-mail: This email address is being protected from spambots. You need JavaScript enabled to view it.
2
Departament d’Astronomia i Astrofísica, Universitat de València, C/ Dr. Moliner, 50, 46100 Burjassot, València, Spain
3
Observatori Astronòmic, Universitat de València, C/ Catedràtic Beltrán 2, 46091 Paterna, València, Spain
4
Max-Planck-Institut für Radioastronomie, Auf dem Hügel 69, 53121 Bonn, Germany
5
Hamburger Sternwarte, Universität Hamburg, Gojenbergsweg 112, 21029 Hamburg, Germany
Received:
24
June
2019
Accepted:
4
September
2019
Abstract
Context. The emission and proper motion of the terminal hotspots of active galactic nucleus (AGN) jets can be used as a powerful probe of the intergalactic medium. However, measurements of hotspot advance speeds in active galaxies are difficult, especially in the young universe, because of the low angular velocities and the low brightness of distant radio galaxies.
Aims. Our goal is to study the termination of an AGN jet in the young universe and to deduce physical parameters of the jet and the intergalactic medium.
Methods. We used the LOw Frequency ARray (LOFAR) to image the long-wavelength radio emission of the high-redshift blazar S5 0836+710 on arcsecond scales between 120 MHz and 160 MHz.
Results. The LOFAR image shows a compact unresolved core and a resolved emission region about 1.5 arcsec to the southwest of the radio core. This structure is in general agreement with previous higher-frequency radio observations with the Multi-Element Radio-Linked Interferometer Network (MERLIN) and the Very Large Array (VLA). The southern component shows a moderately steep spectrum with a spectral index of about ≳ − 1, and the spectral index of the core is flat to slightly inverted. In addition, we detect for the first time a resolved steep-spectrum halo with a spectral index of about −1 surrounding the core.
Conclusions. The arcsecond-scale radio structure of S5 0836+710 can be understood as a Faranoff–Riley (FR) II radio galaxy observed at a small viewing angle. The southern component can be interpreted as the region of the approaching jet’s terminal hotspot, and the halo like diffuse component near the core can be interpreted as the counter-hotspot region. From the differential Doppler boosting of both features, we can derive the hotspot advance speed to (0.01 − 0.036) c. At a constant advance speed, the derived age of the source would exceed the total lifetime of such a powerful FR II radio galaxy substantially. Thus, the hotspot advance speed must have been higher in the past, in agreement with a scenario in which the originally highly relativistic jet has lost collimation as a result of instability growth and has transformed into an only mildly relativistic flow. Our data suggest that the density of the intergalactic medium around this distant (z = 2.22) AGN could be substantially higher than the values typically found in less distant FR II radio galaxies.
Key words: galaxies: active / galaxies: jets / galaxies: individual: S5 0836+710 / radio continuum: galaxies / techniques: high angular resolution / techniques: interferometric
Images of all individual bands are only available at the CDS via anonymous ftp to cdsarc.u-strasbg.fr (130.79.128.5) or via http://cdsarc.u-strasbg.fr/viz-bin/cat/J/A+A/631/A49
© ESO 2019
1. Introduction
Radio-loud active galactic nuclei (AGN) can eject powerful double-sided relativistic jets (Blandford et al. 2019) into the intracluster medium (ICM) that emit synchrotron emission and can reach distances of Megaparsecs. The most powerful of these sources exhibit so-called Faranoff–Riley (FR) II morphologies (Fanaroff & Riley 1974) in which the jets are terminated in high surface-brightness regions called hotspots, where the jets interact with the surrounding medium. FR II radio galaxies have been studied extensively at centimeter wavelength with the Very Large Array (VLA; e.g., O’Dea et al. 2009), estimating ages, velocities, magnetic fields, total lifetime, ambient gas densities, and other quantities.
Blazars are a subclass of AGN, whose jets are aligned at a small angle to the line of sight toward Earth. They can be classified into BL Lac objects and flat-spectrum radio quasars (FSRQs). According to the AGN unified scheme (Antonucci 1993; Urry & Padovani 1995), FSRQs are the beamed counterparts of FR II radio galaxies. Because of relativistic bulk motion of plasma at small inclination angles, the compact (i.e., parsec-scale) emission of blazar jets becomes drastically Doppler boosted and can be observed out to very high redshifts.
According to synchrotron theory, electrons with Lorentz factor γ emit at frequencies ν ∼ 10−6γ2B2 GHz (with B in mG). High radio-frequency observations thus typically probe emission from electrons at γ > 1000. The emitted spectrum of large-scale components associated with AGN jets (unbeamed lobe emission and moderately beamed hotspot emission) can be described by a power law, Fν ∝ να, with the spectral index α typically in the range −0.5 to −1), while the beamed emission from the central jet in blazars is typically characterized by flat spectral indices α ∼ 0. Consequently, blazars have been studied extensively at high radio frequencies, where the jet dominates and Very-Long-Baseline Interferometry (VLBI) techniques offer unprecedented angular resolution of the inner jet region (Zensus 1997). The low-frequency properties of blazar lobe-emission have received less attention in the past decades, however.
Several further constraints affect the study of large-scale blazar observational data. Owing to the strong projection effects at the small inclination angles involved, the emission of the two lobes associated with the jet and counterjet can blend. Moreover, the hotspots of jet and counterjet are subject to noticable differential Doppler boosting due to the mildly relativistic advance speeds of hotspots in the intergalactic medium (O’Dea et al. 2009). Light travel-time differences between both jets can affect the observed arm ratios and cause differential aging of hotspot and counter-hotspot.
These problems can partially be overcome with high-resolution observations at long observing wavelengths, as provided by the LOw Frequency ARray (LOFAR; van Haarlem et al. 2013), which offers unprecedented sensitivity at 40 − 240 MHz and an angular resolution greatly improved over that of previous instruments. The low-energy electron population (γ < 1000) responsible for the blazar-lobe emission can give us unique new insights into the large-scale structure of blazars and therefore is a probe of the oldest observable structures in these powerful sources. In particular, while the counter-jets of blazars are typically strongly debeamed and therefore unobservable, the lobe and hotspot emission associated with these counter-jets are expected to be less strongly debeamed. Because of their steep radio spectrum and small projected scales, they can be detectable in LOFAR observations even though they remained undetected in previous observations with higher frequency and/or lower angular resolution.
The powerful high-redshift (z = 2.218) blazar S5 0836+710 has been observed with the VLA by Cooper et al. (2007) at 1.4 GHz. At this moderately low frequency, the VLA (in A configuration) did not resolve the kiloparsec-scale structure of the source. Higher frequency VLA observations (e.g., O’Dea et al. 1988) and observations with the Multi-Element Radio-Linked Interferometer Network (MERLIN) at 1.6 GHz (Hummel et al. 1992) have shown a single extended and polarized emission feature about 1.5 arcsec south of the jet core without any visible emission bridge between it and the core and without any apparent counterpart on the other side of the core. Perucho et al. (2012a,b) suggested that the jet in S5 0836+710 is subject to the development of Kelvin–Helmholtz (KH) instability (Perucho et al. 2012a) and that this instability could be the cause of jet disruption and generation of a decollimated radio structure at arcsecond scales (Perucho et al. 2012b), explaining the prominent extended feature observed by O’Dea et al. (1988) and Hummel et al. (1992). However, Perucho et al. (2012b) pointed out that the disruption site would have to be associated with intense dissipation of kinetic energy, which is not observed at any point between the inner jet and the putative relic feature. Another problem in the jet-disruption scenario is related to the one-sided kiloparsec-scale morphology because no corresponding relic or lobe associated with the counter-jet can be observed. In this paper we present new results from LOFAR observations that solve these problems. The overall extended arcsecond-scale structure can be interpreted as a classical but strongly projected double-sided source morphology in which the southern feature is a hotspot associated with the approaching jet rather than a disrupted jet relic.
The following sections are structured as follows: in Sect. 2 we give observational parameters of the LOFAR observation of S5 0836+710 and describe the data reduction. The resulting images and derived quantities are presented in Sect. 3. Section 4 presents a discussion of the observational data and implications. Throughout the paper, we use the following cosmological parameters: H0 = 71 km s−1 Mpc, Ωm = 0.27 and ΩΛ = 0.73.
2. Observation and data reduction
We observed S5 0836+710 on June 17, 2015, with the LOFAR High Band Antenna (HBA) array. The observation time was 4 h covering the full frequency range between 117.5 MHz and 162.6 MHz. 3C 196, which was used as the primary flux-density calibrator, was observed for 10 min at the beginning of the observing run. Data were recorded in 8-bit mode in 231 subbands with a bandwidth of 192 kHz each and averaged into 14 frequency bands, each with 3.12 MHz bandwidth, and correlated with the COrrelator and Beamforming Application platform for the Lofar Telescope (COBALT) correlator (Broekema et al. 2018). Given the known highly compact structure of S5 0836+710, we used only the international LOFAR stations1 and analyzed the data using standard methods of VLBI (e.g., Moran & Dhawan 1995) using the Astronomical Image Processing System (AIPS; Greisen 2003) package. In this process, the data were averaged over 16 s in time so that the field of view contained only the target source. The resulting (uv) coverage is shown in Fig. 1 and the measured visibilities as a function of (u,v) radius are shown in Fig. 2. Images were created with self-calibration techniques using DIFMAP (Shepherd 1997) directly on target, which was possible because of the bright and compact core emission present in S5 0836+710. Four frequency bands had to be discarded because the data quality was insufficient, which is presumably due to the bandpass shape and radio-frequency interference (RFI). The total flux density picked up in the full image was calculated and used to compute a correction factor by comparing to the total flux density of the flux calibrator known from a low-resolution image made with the calibrated LOFAR core stations. This factor was applied to the high-resolution model, and the visibilities between the international stations were self-calibrated with this corrected model. This process led to fully calibrated LOFAR VLBI images.
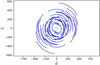 |
Fig. 1. (uv) coverage of the international LOFAR data set at 135 MHz. |
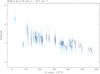 |
Fig. 2. Measured visibilities in the 135 MHz LOFAR data set as a function of (u,v) radius. Blue dots represent visibilities, and red dots show the model developed in the hybrid imaging process. |
3. Results
Figure 3 shows a stacked image of the 11 bands (the images of the individual bands are available at the CDS) corresponding to a central frequency of 143 MHz and a bandwidth of 34 MHz. The general structure is in agreement with previous higher frequency observations of S5 0836+710 on comparable scales and angular resolution (see especially Figs. 1 and 5 in Hummel et al. 1992; Perucho et al. 2012b, respectively). The source shows a compact unresolved core and a resolved emission region between 1 and 2 arcsec to the southwest of the radio core. The core is known to contain a southward-directed compact VLBI jet with an extent of about 200 mas or 1.5 kpc (Perucho et al. 2012a) that shows signs of growing instabilities with distance downstream. These were thought to lead to a full disruption of the jet before it is able to reach arcsecond scales (Perucho et al. 2012b). In this scenario, the southern component was interpreted as a subrelativistic relic of the disrupted jet that continues propagating downstream and interacting with the intergalactic medium. These features are generally expected to show steep spectral indices2 with −2 < α < −1 (Pandey-Pommier et al. 2016).
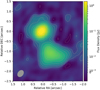 |
Fig. 3. LOFAR stacked image of 11 frequency bands resulting in an effective central frequency of 143 MHz and a 34 MHz bandwidth. The lowest contour level corresponds to 3σ significance. The contour levels are drawn at (−2, 2, 4, 8, etc.) times 2.7 mJy beam−1. The rms is 3.1 mJy beam−1. The beam size (shown in the bottom left corner) is 0.459″ × 0.308″ with a position angle of −39.1°. The images of the individual bands are available at the CDS. |
To test this scenario, we created a spectral-index image using the 11 individual frequency bands and fitting a power law to each individual pixel (see Fig. 4). The southern component shows a moderately steep spectrum with a spectral index of about ≳ − 1, and the spectral index of the core is flat to slightly inverted. An additional striking feature of the LOFAR spectral-index image is a resolved steep-spectrum halo with a spectral index of about −1 surrounding the core. This halo has not been seen in previous higher frequency images of S5 0836+710 and is only revealed by the good sensitivity and high angular resolution of LOFAR in the sub-GHz regime.
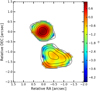 |
Fig. 4. Spectral index map of 11 frequency bands that were pixel-wise fit to the model. The contour levels are obtained from the 129 MHz image drawn at (−2, 2, 4, 8, etc.) times 15 mJy beam−1. See the CDS material for images of the individual-bands from which this map has been produced. |
For comparison, we produced a second spectral index map between the LOFAR band at 138 MHz and 1.6 GHz (obtained from the MERLIN observation on March 1, 2008; see Hummel et al. 1992), which is shown in Fig. 5. The core spectral index is affected by source variability between the LOFAR (2015) and the MERLIN (2008) observations, but shows a roughly flat spectrum. The steep-spectrum halo is marginally visible, and its spectral slope is consistent with the LOFAR-only spectral index image (Fig. 4). The southern component shows a spectral index of about −0.7 between 138 MHz and 1.6 GHz and is therefore also consistent with the LOFAR-only data within the given accuracy.
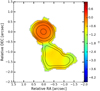 |
Fig. 5. Spectral index image between 1.6 GHz (MERLIN) and 138 MHz (LOFAR). The contour levels are obtained from the MERLIN image and are drawn at (−2, 2, 4, 8, etc.) times 30 mJy beam−1. |
Both spectral index images consistently suggest that LOFAR resolves the central emission region into a core-halo structure. To test this, we model-fit the LOFAR visibility data in this region with two superimposed Gaussian components in the image domain. We represented the core with an unresolved bright Gaussian component and modeled the halo with a broader and fainter Gaussian component. For visualization, we subtracted the unresolved core component from the full LOFAR image to obtain the brightness distribution shown in Fig. 6. The residual image reveals the diffuse emission centered at a small offset of ≲0.01 arcsec from the core. The size of this second diffuse component is approximately the same as the size of the southern component and (1.2 ± 0.2) Jy in flux density, translating into an intrinsic luminosity of (4.1 ± 0.7)⋅1029 W Hz−1.
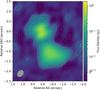 |
Fig. 6. Residual LOFAR image after subtraction of the 2D Gaussian modeled core component. The lowest contour is at 3σ significance. Contour levels are shown at (−2, 2, 4, 8, etc.) times 2.7 mJy beam−1. The rms is 3.1 mJy beam−1. The beam size (shown in the bottom left corner) is 0.459″ × 0.308″ with a position angle of −39.1°. |
4. Discussion
In this section, we provide circumstantial evidence that shows that the large-scale morphology of S5 0836+710 can be understood as a classical FR II radio galaxy seen at a small inclination angle. In this model, the southern component can be understood as a face-on hotspot, hotspot relic, or hotspot-lobe structure of the approaching jet, and the halo can be associated with emission of the hotspot and/or lobe on the counter jet side. We use the observational parameters to derive jet parameters and constrain the density of the ICM surrounding the radio source S5 0836+710.
4.1. Interpretation of the southern emission region as a face-on hotspot
The spectral index of the southern component in S5 0836+710 is only moderately steep and does not reach values expected from a bona fide radio relic of a disrupted jet as seen in other sources (Pandey-Pommier et al. 2016). The magnetic field in this region is circumferential at the southeastern edge (O’Dea et al. 1988), as it is typical for quasar hotspots (Swarup et al. 1984). The field seems to be aligned with the western region of the large-scale structure. Altogether, it can be interpreted in this respect as an emission region associated with a hotspot plus a lobe, in which the field is aligned along the shock in the west, as observed in other FR II sources (Kharb et al. 2008). We therefore measured the size of the southern component by model-fitting a Gaussian component to the LOFAR data in all 11 bands to test whether its extent is consistent with an active FR II hotspot region seen face on. The full extent of the emission region is about 9 kpc with an average flux density of (1.4 ± 0.3) Jy, translating into an intrinsic luminosity of (5 ± 1)×1029 W Hz−1. At a distance of 17.88 Mpc, this is indeed on a scale of typical hotspot diameters in powerful FR II radio galaxies (Jeyakumar & Saikia 2000; Perucho & Martí 2003; Kawakatu & Kino 2006).
Alternatively, it is possible to find a model representation where only the brightest peak of the southern component is modeled with a Gaussian of about 5 kpc in diameter and a flux density of (1.2 ± 0.2) Jy (while residual emission on somewhat larger scales can be represented either by an additional wider Gaussian or by a hybrid model invoking a distribution of CLEAN components). This latter representation would model a physical scenario of a hotspot surrounded by a lobe. In this model representation, the size of the high surface-brightness feature is also still consistent with typical sizes of hotspots in FR II radio galaxies.
The unusual irregular morphology of the putative hotspot might indeed just be an effect of the high angular resolution and the small inclination angle at which the system is observed. If, as suggested by Perucho et al. (2012b), this southern emission component does represent the relic of the hotspot after the jet has been transformed into a subrelativistic or mildly relativistic broad flow, then the loss of collimation must have taken place fairly close upstream of the terminal feature because it obviously has not expanded substantially since then.
4.2. Interpretation of the source morphology as an FR II radio galaxy at a small viewing angle
The kiloparsec-scale structure of S5 0836+710 is consistent with a double-sided source, reminiscent of a highly projected radio-galaxy image onto which a strongly beamed unresolved core component is superimposed. In this interpretation, the southern diffuse component can be interpreted to be associated with the hotspot region of the approaching jet and the halo like diffuse component near the core can be interpreted as the counter-hotspot region. Because the distance to the core is larger for the hotspot than it is for the counter-hotspot, the system cannot be fully symmetric. However, at small inclination angles, intrinsically small bends or misalignment angles can be increased to substantially larger apparent offsets in projection. A possible geometry of the system is shown in Fig. 7.
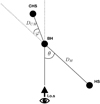 |
Fig. 7. Model of the source geometry in S5 0836+710 as an FR II radio galaxy observed at a small inclination angle θ. HS denotes the hotspot region closer to the observer, and CHS denotes the counter-hotspot region. The different arm lengths are due to the different light travel times (see Appendix A). The two jets are misaligned by φ from a straight jet/counter-jet axis. |
Interpreting the southern emission feature as the hotspot region and the halo-component near the core as the counter-hotspot region, we calculate the brightness ratio of the two regions to be Fh/Fch = (1.19 ± 0.11). This brightness ratio can be used to constrain the parameter space for inclination angle, misalignment, and the advance speed βh of the jet head, which we assume to be the same for both hotspots. Advance speeds in FR II radio galaxies are generally assumed to be mildly relativistic with values of up to 0.1 c–0.5 c (O’Dea et al. 2009), depending on the deviation from the minimum-energy conditions. Under a small inclination angle, such speeds can lead to notable differential boosting effects. In this framework, we thus expect
 (1)
(1)
where θ is the inclination angle under which we observe the approaching jet and φ is the misalignment angle of the counterjet with respect to the approaching jet (see Fig. 7).
With the measured spectral index of α = −0.7, the measured brightness ratio of the two hotspot regions, and a viewing angle of θ = 3.2°, as estimated by Pushkarev et al. (2009), this relation constrains the allowed parameter space as seen in Fig. 8. For a given flux ratio, the resulting head advance speed does depend only weakly on the geometry. Considering the uncertainty range of the flux ratio, the advance speed is constrained to the range of 0.010 c–0.036 c. This is comparable to (if on the low end of the distribution of) source advance velocities of distant high-power FR II radio galaxies (O’Dea et al. 2009).
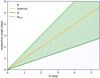 |
Fig. 8. φ lines: misalignment needed to explain the measured flux ratio with respect to a certain β. β values are represented by the drawn arcs, and increase from 0.02339 (leftmost arc) up to 0.02348 (rightmost arc) in increments of 3.4 × 10⁻⁶. |

Hotspot advance speeds of active FR II radio galaxies have commonly been assumed to be roughly constant over the lifetime of a source (O’Dea et al. 2009). In that case, the measured advance speed for S5 0836+710 would imply a source age of 2 × 10⁷ years to 8 × 10⁸ years, which exceeds the maximum total source lifetime of such a powerful source by a factor of 2–80 (e.g., O’Dea et al. 2009; Perucho et al. 2019). Thus, the hotspot advance speed in S5 0836+710 must have been somewhat higher in the past, in agreement with a scenario in which the originally highly relativistic jet has lost collimation due to the growth of instabilities and has transformed into an only mildly relativistic flow, as suggested by Perucho et al. (2012b).
The hotspot region was modeled with a single Gaussian component for each band. Averaging all bands, we measure an apparent opening angle (core to hotspot) of (25 ± 2)°. From this we can derive that the inclination angle is unlikely to be much larger than 15° because that would imply an intrinsic opening angle of ≳7°. On the other hand, it is highly improbable that the inclination angle is much smaller than about 1.5° because otherwise, the total deprojected source size of > 1 Mpc would be larger than the maximum known sizes of radio sources (Jeyakumar & Saikia 2000). At the preferred inclination angle of θ = 3.2° (Pushkarev et al. 2009), the measured apparent opening angle implies an intrinsic opening angle of about 1°, which is consistent with the conclusions of Hummel et al. (1992).
An independent additional constraint on the inclination and the misalignment angles follows from the simple geometric argument that we see the hotspot region at a distance of about 1.5 arcsec from the core and the counter-hotspot region is located within about 0.5 arcsec from the core (because at this distance the core and the counter-hotspot start to merge into a blended feature at the beamsize of our LOFAR image). We thus require a misalignment angle φ ≳ 2.5°.
The misalignment φ needed to explain both the observed morphology and the hotspot region brightness ratio is thus in the range 2.5°–5°. Within the range of typical inclinations of blazars toward Earth, this leaves a relatively large parameter space (see Fig. 8) that is fully consistent with expectations for the special case of S5 0836+714. These values are indeed common among powerful FR II radio galaxies. For example, misalignment angles in 3C sources are known to extend up to values of about 12° or more (Leahy & Williams 1984). We thus consider the interpretation of the S5 0836+710 large-scale morphology as an FR II radio galaxy at a small viewing angle as realistic.
4.3. Derivation of the jet parameters
The total jet power for a relativistic jet is parameterized as (see, e.g., Perucho et al. 2017):
 (2)
(2)
where  is the jet specific enthalpy, Γj is the jet Lorentz factor, ρj is the jet rest mass density, vj is the jet velocity, c is the speed of light, Bϕ is the toroidal field in the observer’s frame, γj is the ratio of specific heats of the jet gas, and Aj is the jet cross-section. The first term in Eq. (2) includes the kinetic, internal, and rest-mass energy contributions, and the second term stands for the magnetic energy of the jet.
We can assume (see Appendix B) that the jet is kinetically dominated and in the cold regime (i.e., its magnetosonic Mach number is high). Furthermore, taking into account that the advance speed as measured by LOFAR is also so slow, the velocity of the bulk plasma flowing into the hotspot can be assumed to be only mildly relativistic at most (see also Appendix C for the relativistic derivation). Under these conditions, the magnetic and pressure terms can be neglected and Eq. (2) simplifies to
 (3)
(3)
Across a strong shock, the hotspot pressure is (e.g., Landau & Lifshitz 1987)
 (4)
(4)
In this equation, we need to define the jet radius at the hotspot, Rj, h, which can be approximated as the hotspot radius. Because we do not know whether the southern radio structure includes the hotspot and part of the lobe or if it is the hotspot, we considered half of the whole region as the jet radius (4.5 kpc) and half of the fitted component, which represents the brightest region within the hypothetical lobe (2.5 kpc). Although the polarization seems to favor the latter interpretation (see the previous section), we study both cases here. Furthermore, we need an estimate for vj at the hotspot, vj, h. As we show in the following paragraphs, any reasonable input value is sufficient because we define an iterative method to derive its convergence value. When the hotspot pressure is obtained, we can use equipartition between the nonthermal particles and the magnetic field, as reported for FR II hotspots (see e.g., Hardcastle & Worrall 2000), to obtain a value of the magnetic field at the interaction site.
The value of the magnetic field prior to the reverse shock  can be constrained by assuming conservation of the magnetic flux from the 1.6 GHz jet to the interaction site3. Applying the magnetohydrodynamcis (MHD) jump conditions at the reverse shock that give rise to the hotspot,
 (5)
(5)
allows us to derive a new estimate for vj, h. Setting a convergence criterion for this parameter at a precision of 10−3, we can determine the relevant parameters of the problem.
We applied this method to four different sets of hotspot velocity and radius: the possible combinations of vh = 0.01 − 0.036 c, and Rj, h = 2.5 − 4.5 kpc. Table 1 shows the resulting values. The ranges given for the parameters correspond to the values derived for rh = 4.5 and 2.5 kpc, and the smaller numbers of pressure, magnetic field and density correspond to the wider hotspot.
Jet parameters at the hotspot.
We find that the jet velocity at the interaction site is substantially lower than that of the VLBI jet. This can be explained in terms of kinetic energy dissipation by the growth of the KH modes and/or integrated entrainment along the jet (e.g., Perucho et al. 2012a,b). The extreme value of βj, h = 0.54, derived for βh = 0.036, provides an a posteriori justification of our assumption of a mildly relativistic flow because possible relativistics corrections are limited by the Lorentz factor Γj, h ≲ 1.2.
Our spectral analysis provides us with values for the magnetic field from basic synchrotron theory that are displayed in Fig. 9 in terms of the minimum electron Lorentz factor, using Eq. (6) in Pyrzas et al. (2015). The equipartition magnetic field derived for the hotspot region results in a value of γmin ≤ 100, which represents a plausible number (Meisenheimer et al. 1989, 1997).
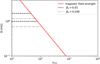 |
Fig. 9. Minimum energy assumption, see Pyrzas et al. (2015), yields magnetic field strengths in the range |
When we compare the parameters in Table 1 to those obtained by Meisenheimer et al. (1989) for different classical FRII hotspots using spectral analysis, we see that our hotspot region values for pressure and magnetic fields are at approximately or slightly higher than their maximum values (Bh ∼ 0.1 − 1 mG, Ph ∼ 0.1 − 1 × 10⁻⁸ dyn cm−2 in their case). Taking into account that S5 0836+710 is a powerful jet that probably interacts with a dense ICM, we can conclude that the parameters derived by us are in agreement with the typical values that Meisenheimer et al. (1989) obtained using a different method.
From the derived parameters, we can proceed and estimate the jet density prior to the reverse shock using Eq. (B.1). The results are also given in Table 1. The jet number density in the hotspot region lies in the range nj, h = 0.1 − 4.0 cm−3 when the mass flux is dominated by pairs or nj, h = 0.05 − 2.3 × 10⁻³ cm−3 when it is dominated by protons.
In the case of a leptonic jet, this implies a total particle number flux of  at the hotspot. This flux falls to 0.6 − 3.0 × 1051 s−1 in the case of a proton-dominated jet at these scales. A pair jet can, nevertheless, be discarded on the basis of energetic argumentation: taking into account that the jet is relativistic at VLBI scales, the energy flux in the form of rest-mass energy must necessarily have changed. As a conclusion, pollution by protons is required to occur along the jet and the jet is likely to be proton dominated on large scales.
4.4. Implications for the intracluster medium
From ram pressure confinement, we obtain a minimum value of  , and a maximum of 1.5 × 10⁻²⁴ g cm−3 for the possible ranges of Rj and vh. The maximum derived (which corresponds to the lowest hotspot advance speed) would imply proton number densities of ∼1 cm−3, which is approximately at interstellar medium values, and it is therefore unrealistically high for the ICM at 240 kpc from the active nucleus. Increasing the hotspot advance speed to 0.036 c can yield values as low as ∼0.01 cm−3. The dependencies of the derived ambient density on the observational parameters thus favor hotspot advance speeds in the upper range of the interval given by brightness asymmetry. This result is, however, still one to two orders of magnitude above the values found by O’Dea et al. (2009). In that work, no clear trend of the density of the ICM is found with redshift out to values of z ≲ 1.8. S5 0836+710 is located at z = 2.22 so that we probe in principle the density of the ICM at a somewhat earlier evolutionary stage of the expanding universe. However, the study of a single source does not allow us to draw any conclusions on possible systematic cosmological effects. S5 0836+710 might rather lie within a particularly overdense cluster such as the local FR II radio galaxy Cygnus A. Nevertheless, our method can in principle be applied to large samples of high-power blazars and has the potential to reach out to even higher redshifts.
5. Conclusion
The LOFAR telescope provides unprecedented sensitivity and angular resolution in the 100 MHz regime. For compact sources whose structure is only on angular scales of arcseconds and smaller, the international LOFAR stations can be used effectively as a VLBI array. Further improvements in image fidelity can be achieved by including Dutch core-array stations (which can be obtained by improved calibration techniques) and in future observations by the new international stations in Poland, Ireland, and Italy, yielding a maximum baseline of ∼1900 km. For the observation of blazars, the unique LOFAR capabilities are crucial because of the small angular scales involved and the beamed core emission, which dominates the extended structure at higher frequencies. Future LOFAR studies of blazar samples will be able to address unsolved questions about the unification of blazars and radio galaxies, such as the occurrence of morphological features in BL Lac objects (Cooper et al. 2007; Kharb et al. 2010) that are typical of FR II galaxies.
We have demonstrated that blazar observations with LOFAR can also be used to probe the ICM out to cosmological distances. Our results suggest that the density of the intergalactic medium around the distant (z = 2.22) blazar S5 0836+710 might be substantially higher than the values found in less distant FR II radio galaxies. However, no generalized statement on a systematic redshift dependence can be derived from a single-source study as presented here because systematic uncertainties and source-specific peculiarities have to be considered. Our method can be generalized and applied to larger numbers of suitable blazars to yield statistically relevant samples of the density of the ICM as a function of redshift, which is independent of and complementary to classical observational methods applied to radio galaxies (e.g., O’Dea et al. 2009). Because of their extreme power and beaming, blazars can be found at higher redshift than radio galaxies, so that the method might eventually prove particularly important for studies of the young universe. The weakly beamed components of interest (hotspots, lobes), however, will be very challenging to detect at redshifts much higher than z = 2 and might have to await the advent of the Square Kilometre Array (SKA).
In June 2015, this included six stations in Germany (DE601-DE605, and DE609), and one station each in Sweden (SE607), France (FR606), and the United Kingdom (UK608).
We use the notation Sν ∝ να, in which a negative spectral index α corresponds to a flux density Sν that decreases with frequency.
This assumption is quite reasonable for conically expanding jets at kiloparsec scales (see, e.g., Komissarov 2012).
Acknowledgments
We thank the anonymous referee for the careful review, which has helped us to improve this paper. This work has been supported by the Spanish Ministerio de Economía y Competitividad (grants AYA2015-66899-C2-1-P and AYA2016-77237-C3-3-P) and the Generalitat Valenciana (grant PROMETEOII/2014/069).
References
- Anile, A. M. 1989, Relativistic Fluids and Magneto-fluids: With Applications in Astrophysics and Plasma Physics (Cambridge: Cambridge University Press) [Google Scholar]
- Antonucci, R. 1993, ARA&A, 31, 473 [Google Scholar]
- Blandford, R., Meier, D., & Readhead, A. 2019, ARA&A, 57, 467 [NASA ADS] [CrossRef] [Google Scholar]
- Broekema, P. C., Mol, J. J. D., Nijboer, R., et al. 2018, Astron. Comput., 23, 180 [NASA ADS] [CrossRef] [Google Scholar]
- Cooper, N. J., Lister, M. L., & Kochanczyk, M. D. 2007, ApJS, 171, 376 [NASA ADS] [CrossRef] [Google Scholar]
- Daly, R. A., Sprinkle, T. B., O’Dea, C. P., Kharb, P., & Baum, S. A. 2012, MNRAS, 423, 2498 [NASA ADS] [CrossRef] [Google Scholar]
- Fanaroff, B., & Riley, J. 1974, MNRAS, 167, 31P [Google Scholar]
- Greisen, E. W. 2003, in Information Handling in Astronomy - Historical Vistas, ed. A. Heck, Astrophys. Space Sci. Lib., 285, 109 [Google Scholar]
- Hardcastle, M. J., & Worrall, D. M. 2000, MNRAS, 319, 562 [NASA ADS] [CrossRef] [Google Scholar]
- Hummel, C., Muxlow, T., Krichbaum, T., et al. 1992, A&A, 266, 93 [NASA ADS] [Google Scholar]
- Jeyakumar, S., & Saikia, D. 2000, MNRAS, 311, 397 [NASA ADS] [CrossRef] [Google Scholar]
- Kawakatu, N., & Kino, M. 2006, MNRAS, 370, 1513 [NASA ADS] [CrossRef] [Google Scholar]
- Kharb, P., Lister, M., & Cooper, N. 2010, ApJ, 710, 764 [NASA ADS] [CrossRef] [Google Scholar]
- Kharb, P., O’Dea, C. P., Baum, S. A., et al. 2008, ApJS, 174, 74 [NASA ADS] [CrossRef] [Google Scholar]
- Komissarov, S. 2012, Central Engines: Acceleration, Collimation and Confinement of Jets (John Wiley and Sons), 81 [Google Scholar]
- Landau, L. D., & Lifshitz, E. M. 1987, in Fluid Mechanics, 2nd edn. (Oxford: Butterworth-Heinemann), Course of Theoretical Physics, 6 [Google Scholar]
- Leahy, J., & Williams, A. 1984, MNRAS, 210, 929 [NASA ADS] [CrossRef] [Google Scholar]
- Marti, J. M., & Muller, E. 1994, J. Fluid Mech., 258, 317 [NASA ADS] [CrossRef] [Google Scholar]
- Meisenheimer, K., Roser, H.-J., Hiltner, P., et al. 1989, A&A, 219, 63 [NASA ADS] [Google Scholar]
- Meisenheimer, K., Yates, M. G., & Roeser, H. J. 1997, A&A, 325, 57 [NASA ADS] [Google Scholar]
- Moran, J. M., & Dhawan, V. 1995, in Very Long Baseline Interferometry and the VLBA, eds. J. A. Zensus, P. J. Diamond, & P. J. Napier, ASP Conf. Ser., 82, 161 [NASA ADS] [Google Scholar]
- O’Dea, C. P., Barvainis, R., & Challis, P. M. 1988, AJ, 96, 435 [NASA ADS] [CrossRef] [Google Scholar]
- O’Dea, C. P., Daly, R. A., Kharb, P., Freeman, K. A., & Baum, S. A. 2009, A&A, 494, 471 [NASA ADS] [CrossRef] [EDP Sciences] [Google Scholar]
- Pandey-Pommier, M., Intema, H., & Heald, G. 2016, in SF2A-2016: Proceedings of the Annual meeting of the French Society of Astronomy and Astrophysics, eds. C. Reylé, J. Richard, L. Cambrésy, et al., 379 [Google Scholar]
- Perucho, M., & Martí, J. M. 2003, PASA, 20, 94 [NASA ADS] [CrossRef] [Google Scholar]
- Perucho, M., Kovalev, Y. Y., Lobanov, A. P., Hardee, P. E., & Agudo, I. 2012a, ApJ, 749, 55 [NASA ADS] [CrossRef] [EDP Sciences] [Google Scholar]
- Perucho, M., Marti-Vidal, I., Lobanov, A. P., & Hardee, P. E. 2012b, A&A, 545, A65 [NASA ADS] [CrossRef] [EDP Sciences] [Google Scholar]
- Perucho, M., Martí, J.-M., Quilis, V., & Borja-Lloret, M. 2017, MNRAS, 471, L120 [NASA ADS] [CrossRef] [Google Scholar]
- Perucho, M., Martí, J.-M., & Quilis, V. 2019, MNRAS, 482, 3718 [NASA ADS] [CrossRef] [Google Scholar]
- Pushkarev, A., Kovalev, Y., Lister, M., & Savolainen, T. 2009, A&A, 507, L33 [NASA ADS] [CrossRef] [EDP Sciences] [Google Scholar]
- Pyrzas, S., Steenbrugge, K., & Blundell, K. 2015, A&A, 574, A30 [NASA ADS] [CrossRef] [EDP Sciences] [Google Scholar]
- Shepherd, M. C. 1997, in Astronomical Data Analysis Software and Systems VI, eds. G. Hunt, & H. Payne, ASP Conf. Ser., 125, 77 [NASA ADS] [Google Scholar]
- Swarup, G., Sinha, R. P., & Hilldrup, K. 1984, MNRAS, 208, 813 [NASA ADS] [Google Scholar]
- Urry, C. M., & Padovani, P. 1995, PASP, 107, 803 [NASA ADS] [CrossRef] [Google Scholar]
- van Haarlem, M., Wise, M., Gunst, A., et al. 2013, A&A, 556, A2 [NASA ADS] [CrossRef] [EDP Sciences] [Google Scholar]
- Vega-García, L. 2018, PhD Thesis, University of Cologne [Google Scholar]
- Vega-García, L., Perucho, M., & Lobanov, A. P. 2019, A&A, 627, A79 [NASA ADS] [CrossRef] [EDP Sciences] [Google Scholar]
- Zensus, J. A. 1997, ARA&A, 35, 607 [NASA ADS] [CrossRef] [Google Scholar]
Appendix A: Light-travel effects on the symmetry between hotspot and counter-hotspot
Because the jet in S5 0836+710 is observed at a small angle to the line of sight, we expect a travel-time delay between the photons emitted from the counter-hotspot and from the hotspot itself. We can estimate the relative observed hotspot to counter-hotspot age and distance to the core by taking into account that the age of the counter-hotspot is tch ≃ Dch/vh (see Fig. 7), assuming that the head of the jet propagates at a similar speed for long distances. Furthermore, we can also claim that tch = th − D/c, that is, the counter-hotspot is seen at a younger age than the hotspot. The difference here is due to the time the photons need to travel the total distance between the two hotspots, D = Dh + Dch. By combining these expressions, we obtain
 (A.1)
(A.1)
and thus
 (A.2)
(A.2)
which for vh = 0.023 c and Dh ≃ 240 kpc (ϑ = 3°) results in Dch = 229 kpc, and an age of about 5 million years younger than the southern hotspot.
Appendix B: Jet power
In the case of a nonrelativistic jet, Eq. (2) becomes
 (B.1)
(B.1)
Vega-García (2018) has provided an estimate of the mean magnetic field along the 1.6 GHz jet of S5 0836+710 using the cooling time of the electrons that emit at this frequency together with the distance along which the jet is observed, resulting in B ≲ 0.01 G. This represents an upper limit of the field strength, as it obviates adiabatic cooling on the observed scales. Using this value, the jet radius at half the jet extension, and the estimated Lorentz factor for the VLBI jet (Γj = 12), Vega-García (2018) derived a jet Poynting flux  , assuming that the dominating field is toroidal.
Following an independent line of derivation, we use the intrinsic hotspot plus counter hotspot luminosities at 150 MHz (9.0 × 1029 W Hz−1, altogether) and the relation given by Daly et al. (2012) between the source luminosity at 178 MHz and the jet kinetic power to estimate the latter, and we obtain Lj ≃ 1047 erg s−1. Although this value is affected by considerable uncertainties, it yields a number corresponding to that expected for powerful FR II jets, as expected for this bright and distant quasar. By comparing the total energy flux with the Poynting flux, we can deduce that the jet is likely to be kinetically dominated at these scales.
A stability analysis of this jet in addition confirms that its Mach number is large, or in other words, that the jet is in the cold regime (hj ≃ c2 and implying γj ≃ 5/3, Vega-García et al. 2019), but is kinetically relativistic at VLBI scales. Table B.1 contains a summary of the jet parameters that are relevant to our study (see Vega-García 2018).
Jet parameters at VLBI scales.
Appendix C: Relativistic case
In Sect. 4.3 we used the approximation of a subrelativistic jet flow close to the hotspot, which proved to be valid because of the limiting flow velocity obtained (βj, h ≤ 0.54). For reference, we also considered the case of a relativistic flow, where the conservation of momentum flux across the shock implies (e.g., Landau & Lifshitz 1987; Marti & Muller 1994)
 (C.1)
(C.1)
For the particle-dominated (cold) jet of S5 0836+710 at these scales (see Appendix B), Pj is much smaller than ρjc2 (implying that hj ≃ c2). Taking into account that for a strong shock vh ≪ vj, it follows that Ph ≫ Pj, and the previous expression results in
 (C.2)
(C.2)
By comparing Eqs. (2) and (C.2), subtracting the rest mass energy of the particles, and neglecting the magnetic field contribution, we obtain for the hotspot pressure
 (C.3)
(C.3)
We approximate the jet radius at the hotspot, Rj, h, to the hotspot radius. As we did before, we now begin an iterative process: we start with βj, h ≃ 1 to find a first value for the hotspot pressure Ph. Equipartition between the nonthermal particles and the magnetic field can then be used to derive the hotspot magnetic field,  . We note that the values derived from Eq. (C.3) lead to upper limits of the hotspot pressure and magnetic field because there is no total transfer of kinetic energy into internal energy across the shock. This is caused by the approximation of the first term in the right-hand side of Eq. (4),
  , to zero.
Then, with the value of the magnetic field derived for the jet at VLBI scales and applying conservation of the magnetic flux (which is a reasonable assumption for conical jets), we derive an estimate of the field intensity immediately before the hotspot. Finally, we can apply the relativistic MHD jump conditions at the reverse shock giving rise to the hotspot (e.g., Anile 1989),
 (C.4)
(C.4)
which, using the value derived for βh, Γh ≃ 1,  , and
, and  , allows us to obtain Γj, hβj, h. From the value of Γj, hβj, h, we get βj, h and bring it back to Eq. (C.3) to continue the iterative method.
In the case of S5 0836+710 with its very low measured head velocity βh, the relativistic expression necessarily leads to the classical approximation, because the kinetic energy, (Γj, h − 1)ρj, hc2vj, hAj, h tends to zero. The Taylor expansion of the Lorentz factor results in the classical kinetic energy.
All Tables
All Figures
|
Fig. 1. (uv) coverage of the international LOFAR data set at 135 MHz. |
| In the text | |
|
Fig. 2. Measured visibilities in the 135 MHz LOFAR data set as a function of (u,v) radius. Blue dots represent visibilities, and red dots show the model developed in the hybrid imaging process. |
| In the text | |
|
Fig. 3. LOFAR stacked image of 11 frequency bands resulting in an effective central frequency of 143 MHz and a 34 MHz bandwidth. The lowest contour level corresponds to 3σ significance. The contour levels are drawn at (−2, 2, 4, 8, etc.) times 2.7 mJy beam−1. The rms is 3.1 mJy beam−1. The beam size (shown in the bottom left corner) is 0.459″ × 0.308″ with a position angle of −39.1°. The images of the individual bands are available at the CDS. |
| In the text | |
|
Fig. 4. Spectral index map of 11 frequency bands that were pixel-wise fit to the model. The contour levels are obtained from the 129 MHz image drawn at (−2, 2, 4, 8, etc.) times 15 mJy beam−1. See the CDS material for images of the individual-bands from which this map has been produced. |
| In the text | |
|
Fig. 5. Spectral index image between 1.6 GHz (MERLIN) and 138 MHz (LOFAR). The contour levels are obtained from the MERLIN image and are drawn at (−2, 2, 4, 8, etc.) times 30 mJy beam−1. |
| In the text | |
|
Fig. 6. Residual LOFAR image after subtraction of the 2D Gaussian modeled core component. The lowest contour is at 3σ significance. Contour levels are shown at (−2, 2, 4, 8, etc.) times 2.7 mJy beam−1. The rms is 3.1 mJy beam−1. The beam size (shown in the bottom left corner) is 0.459″ × 0.308″ with a position angle of −39.1°. |
| In the text | |
|
Fig. 7. Model of the source geometry in S5 0836+710 as an FR II radio galaxy observed at a small inclination angle θ. HS denotes the hotspot region closer to the observer, and CHS denotes the counter-hotspot region. The different arm lengths are due to the different light travel times (see Appendix A). The two jets are misaligned by φ from a straight jet/counter-jet axis. |
| In the text | |
|
Fig. 8. φ lines: misalignment needed to explain the measured flux ratio with respect to a certain β. β values are represented by the drawn arcs, and increase from 0.02339 (leftmost arc) up to 0.02348 (rightmost arc) in increments of 3.4 × 10⁻⁶. |
| In the text | |
|
Fig. 9. Minimum energy assumption, see Pyrzas et al. (2015), yields magnetic field strengths in the range |
| In the text | |
Current usage metrics show cumulative count of Article Views (full-text article views including HTML views, PDF and ePub downloads, according to the available data) and Abstracts Views on Vision4Press platform.
Data correspond to usage on the plateform after 2015. The current usage metrics is available 48-96 hours after online publication and is updated daily on week days.
Initial download of the metrics may take a while.