Fig. 8.
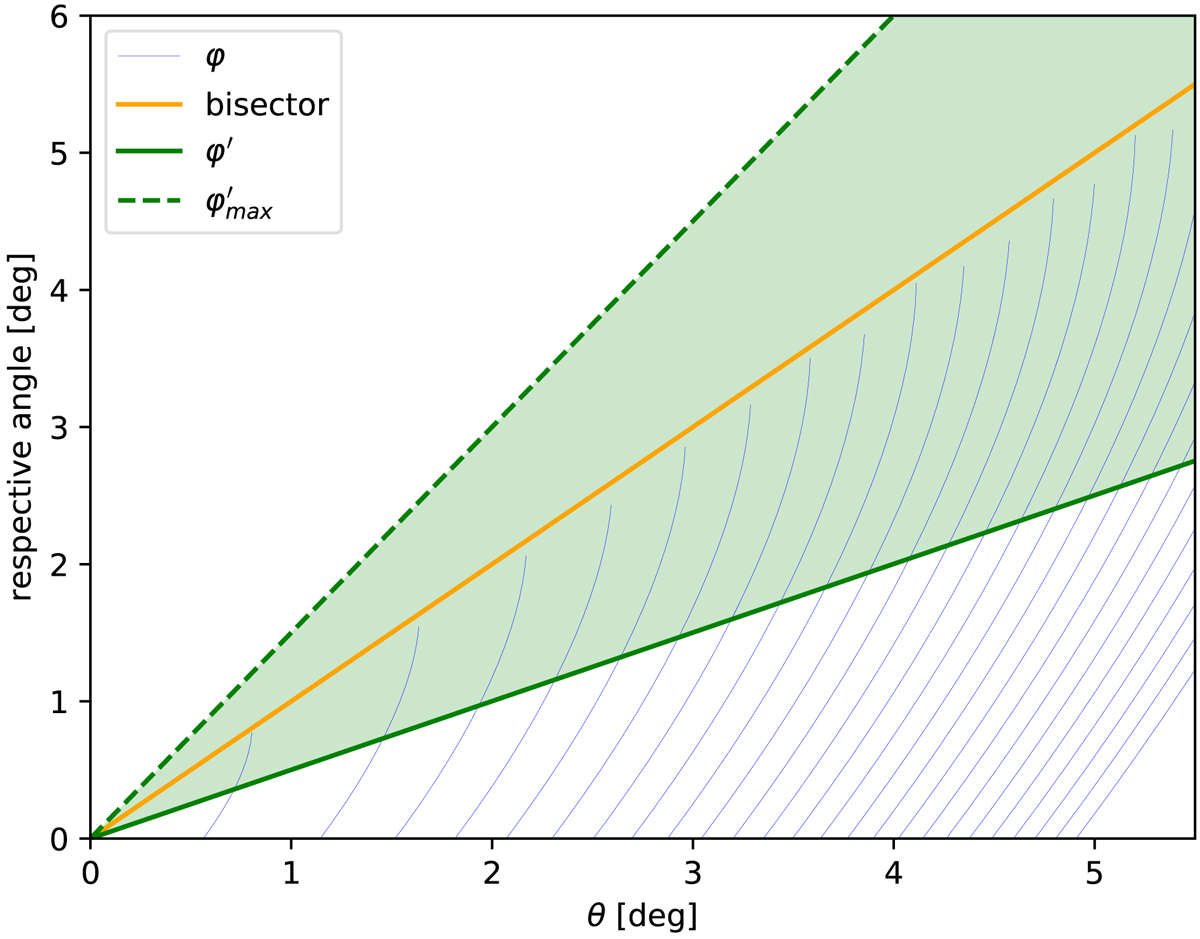
φ lines: misalignment needed to explain the measured flux ratio with respect to a certain β. β values are represented by the drawn arcs, and increase from 0.02339 (leftmost arc) up to 0.02348 (rightmost arc) in increments of 3.4 × 10⁻⁶. ![]() is the minimum needed, and φ′max is the maximum possible misalignment angle resulting from the geometric argument (see text). The confined green area in between is therefore the possible misalignment in order to blend the counter-hotspot region by the bright core.
is the minimum needed, and φ′max is the maximum possible misalignment angle resulting from the geometric argument (see text). The confined green area in between is therefore the possible misalignment in order to blend the counter-hotspot region by the bright core.
Current usage metrics show cumulative count of Article Views (full-text article views including HTML views, PDF and ePub downloads, according to the available data) and Abstracts Views on Vision4Press platform.
Data correspond to usage on the plateform after 2015. The current usage metrics is available 48-96 hours after online publication and is updated daily on week days.
Initial download of the metrics may take a while.