Free Access
Fig. 4.
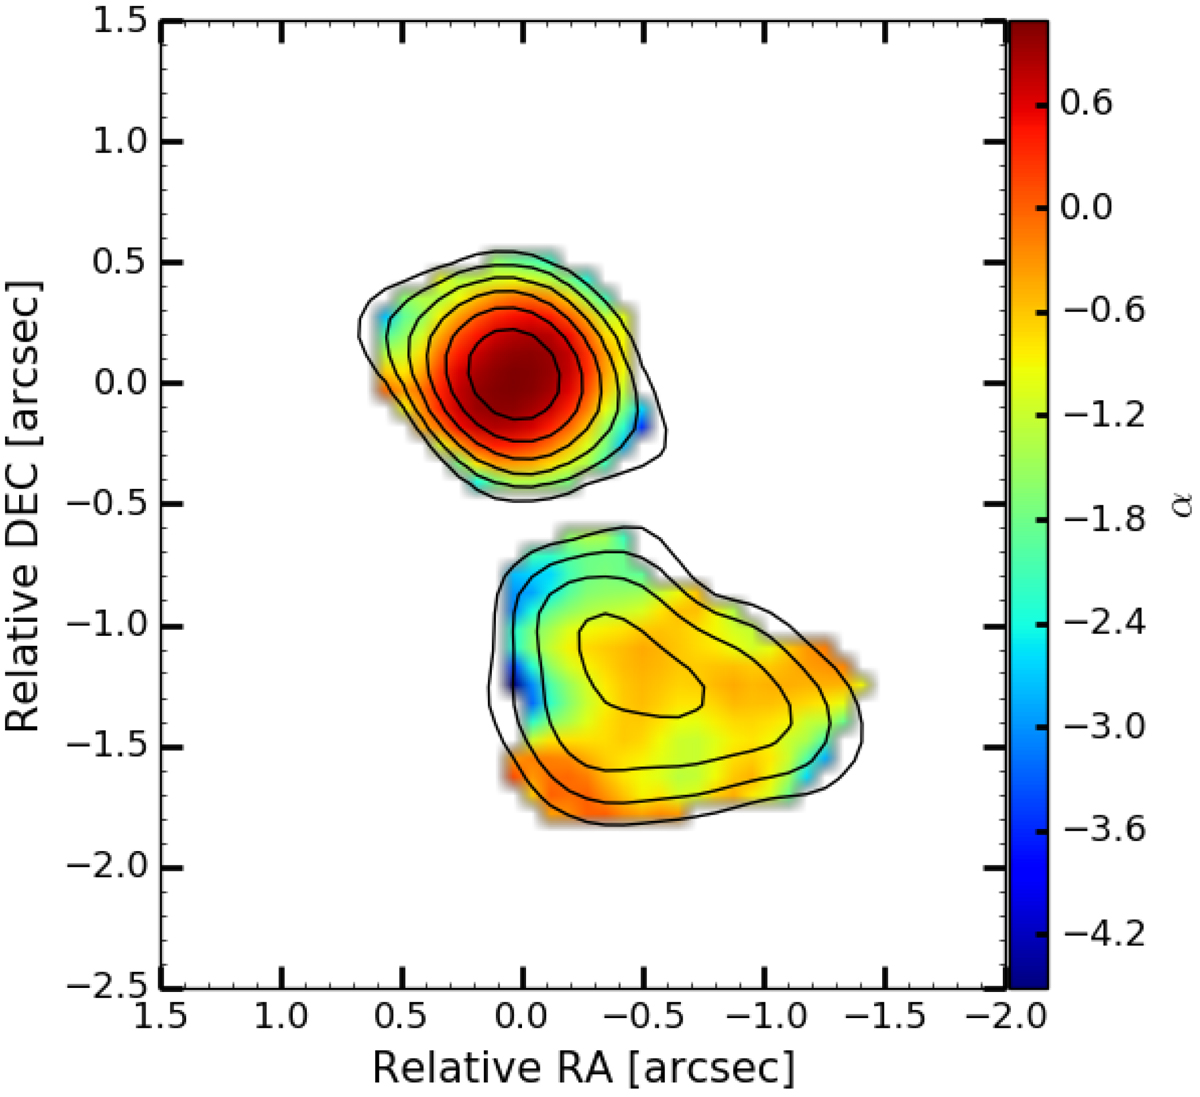
Spectral index map of 11 frequency bands that were pixel-wise fit to the model. The contour levels are obtained from the 129 MHz image drawn at (−2, 2, 4, 8, etc.) times 15 mJy beam−1. See the CDS material for images of the individual-bands from which this map has been produced.
Current usage metrics show cumulative count of Article Views (full-text article views including HTML views, PDF and ePub downloads, according to the available data) and Abstracts Views on Vision4Press platform.
Data correspond to usage on the plateform after 2015. The current usage metrics is available 48-96 hours after online publication and is updated daily on week days.
Initial download of the metrics may take a while.