Fig. 7.
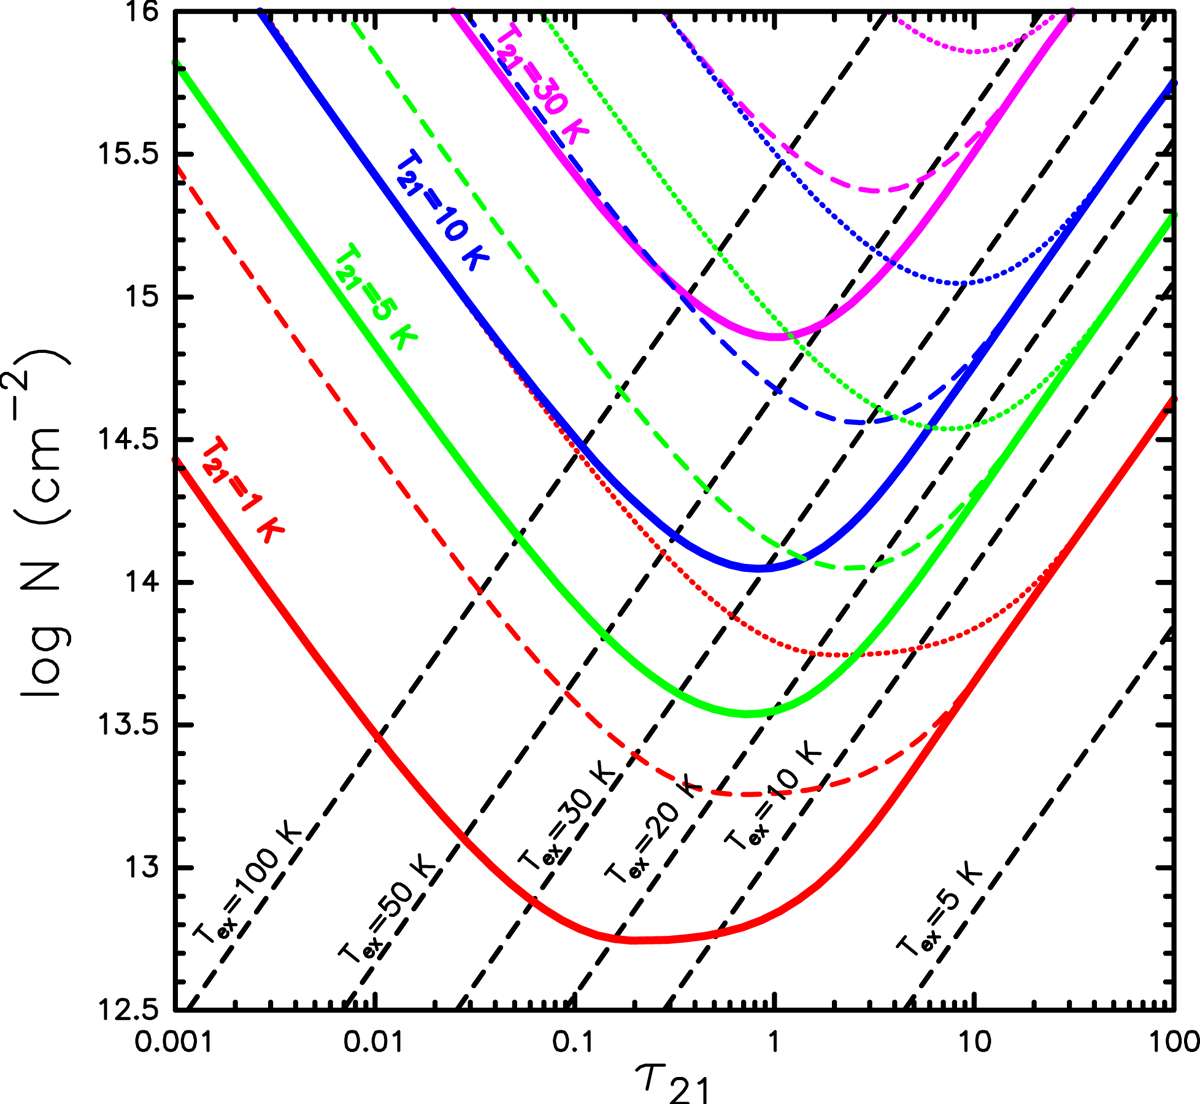
Column density of N2H+ as a function of the estimated optical depth (Fig. 6) of its J = 1−0, F = 2−1 transition for different assumed excitation temperatures (black dashed lines). In colour we represent isotemperature curves of simulated line intensities in main beam temperature scale for the 26.4″ primary beam of the IRAM 30 m at the frequency of this transition. The curves are calculated for different source sizes: extended (continous line); two thirds of the primary beam (dashed); and one third of the primary beam (dotted). The simulation considers a line width Δv = 2 km s−1, and Tbg = 2.73 K.
Current usage metrics show cumulative count of Article Views (full-text article views including HTML views, PDF and ePub downloads, according to the available data) and Abstracts Views on Vision4Press platform.
Data correspond to usage on the plateform after 2015. The current usage metrics is available 48-96 hours after online publication and is updated daily on week days.
Initial download of the metrics may take a while.