Fig. 6.
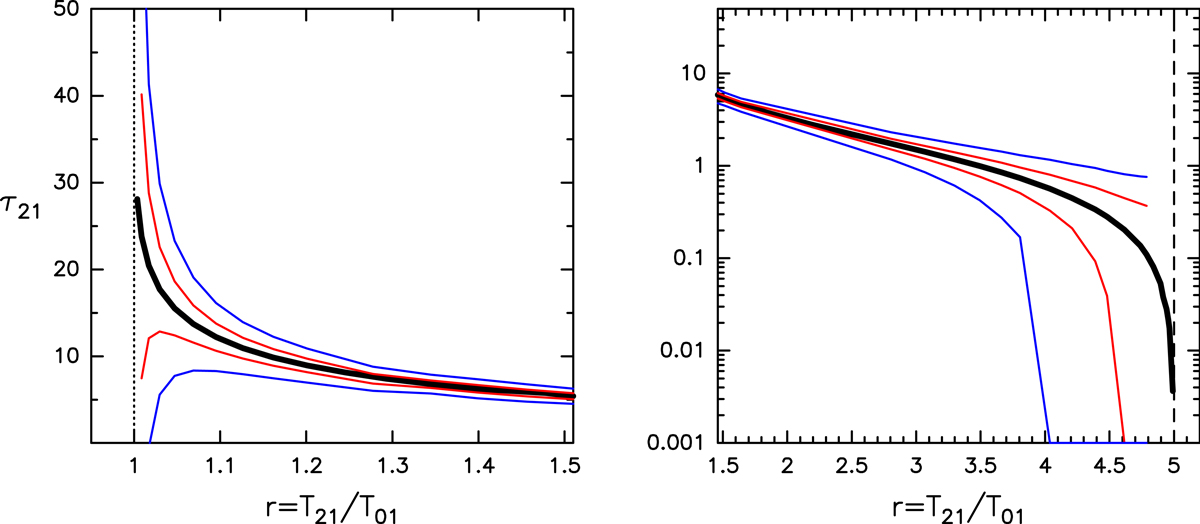
Optical depth to the F = 2−1 hyperfine transition of N2H+ as a function of the ratio of the line intensities of the F = 2−1 to the F = 0−1 shown in black. The line width used in the SLIM simulations is Δv = 2 km s−1 to avoid blending between hyperfine transitions. In red and blue we represent the propagated uncertainties considering that the F = 2−1 hyperfine transitions of N2H+ are detected with S/Ns of 50 and 20, respectively. See Sect. 4.3 for details.
Current usage metrics show cumulative count of Article Views (full-text article views including HTML views, PDF and ePub downloads, according to the available data) and Abstracts Views on Vision4Press platform.
Data correspond to usage on the plateform after 2015. The current usage metrics is available 48-96 hours after online publication and is updated daily on week days.
Initial download of the metrics may take a while.