Fig. 5.
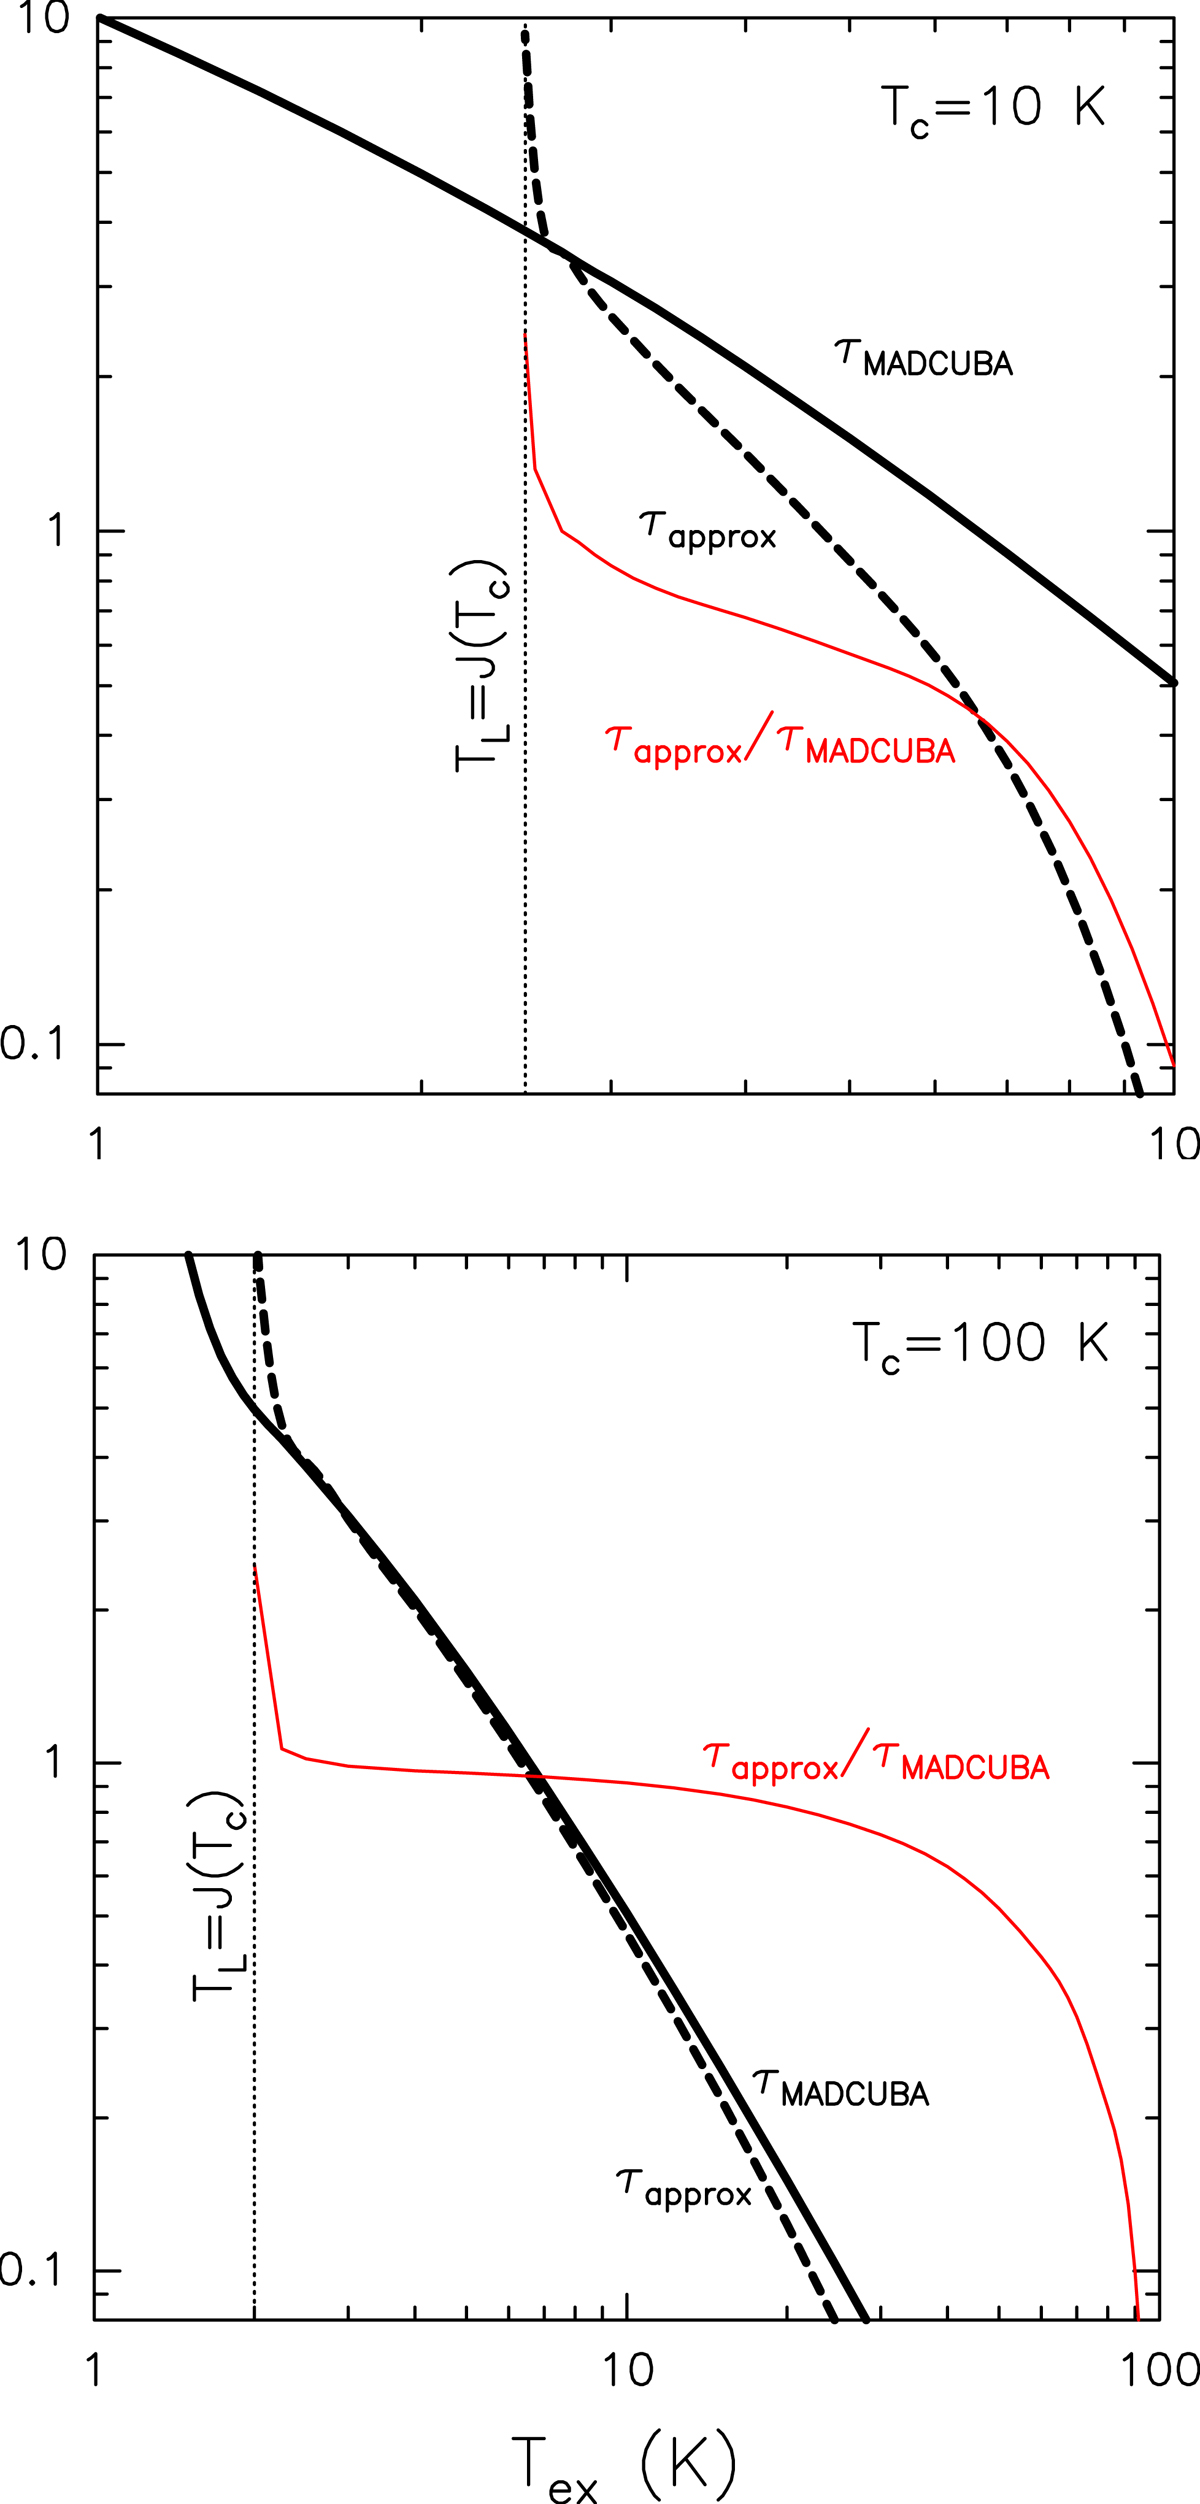
Optical depth of the absorption profile of CO 1-0 calculated by MADCUBA (black continuous line) for Δv = 10 km s−1, log N = 17 cm−2, and Tbg = 2.73 K. From the values measured in the synthetic spectra and using Eq. (32), the approximate optical depth is calculated (black dashed line). The ratio between the two optical depth estimates is shown in red. Top and bottom panels are equal but for the continuum temperatures of 10 and 100 K, respectively. Vertical dotted line represent the temperature for which the line completely absorbs the continuum emission (i.e. TL = J(Tc)), and beyond which the CMB continuum is absorbed.
Current usage metrics show cumulative count of Article Views (full-text article views including HTML views, PDF and ePub downloads, according to the available data) and Abstracts Views on Vision4Press platform.
Data correspond to usage on the plateform after 2015. The current usage metrics is available 48-96 hours after online publication and is updated daily on week days.
Initial download of the metrics may take a while.