Fig. 4.
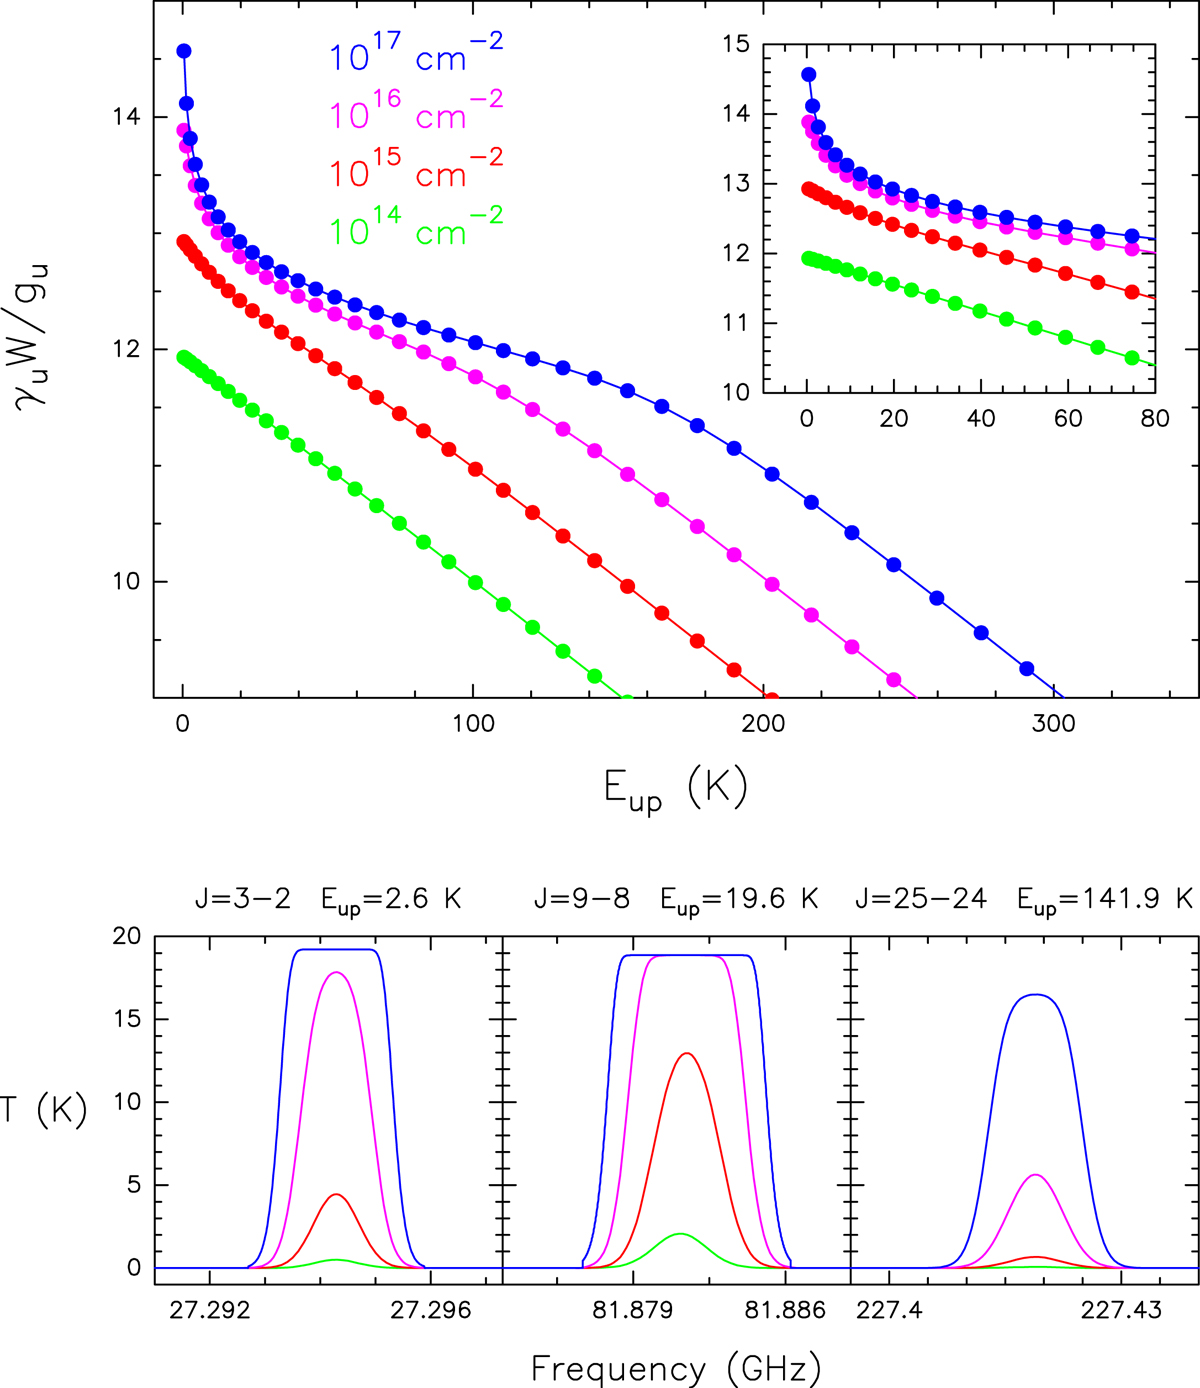
Upper panel: rotational diagram of the first 36 rotational transitions of HC3N generated from the SLIM output synthetic spectra. Physical parameters of Tex = 22 K, Δ = 10 km s−1 and extended source size have been used. The inset figure in the top left corner matches the range of energies displayed in Fig. 2 of Goldsmith & Langer (1999). Lower panel: synthetic spectra of three transitions at representative upper-level energies for the four column densities used to generate the rotational diagram. The effect of opacity is clearly seen in both line saturation and broadening.
Current usage metrics show cumulative count of Article Views (full-text article views including HTML views, PDF and ePub downloads, according to the available data) and Abstracts Views on Vision4Press platform.
Data correspond to usage on the plateform after 2015. The current usage metrics is available 48-96 hours after online publication and is updated daily on week days.
Initial download of the metrics may take a while.