Fig. 2.
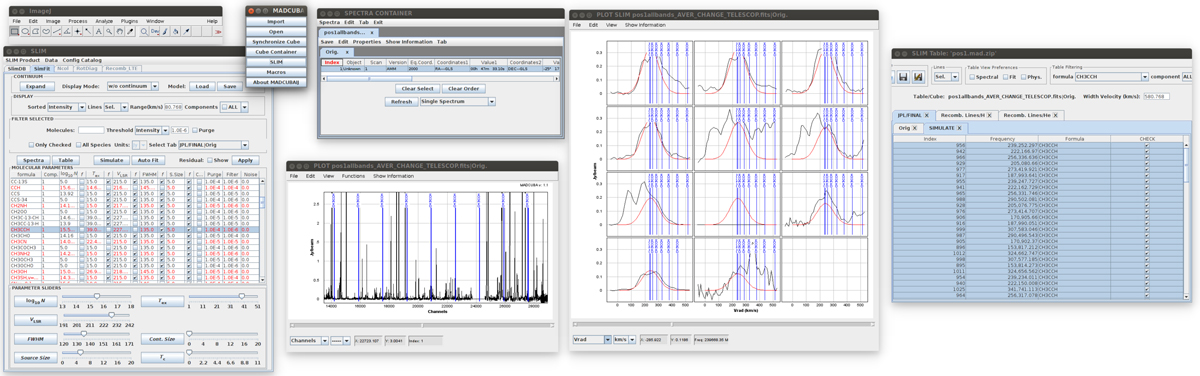
Screenshot showing the use of SLIM within MADCUBA to identify and fit a synthetic LTE model to an observed broadband spectrum. In this case, a 30 000 channel ALMA spectrum is displayed where more than 100 molecular species have been fitted. From top to bottom and left to right, the windows shown are: the main ImageJ window; the main MADCUBA menu; the modelling tab within the SLIM tool with the list of fitted species and the sliders in the bottom to interactively adjust the physical parameters; the spectra container window displaying the currently opened spectra; the plot showing the full spectrum with the transitions of the selected species labeled; the SLIM PLOT showing the synthetic model overlaid on top of the observed spectra zoomed to the brightest transitions of the selected species; the list of transitions of the selected species.
Current usage metrics show cumulative count of Article Views (full-text article views including HTML views, PDF and ePub downloads, according to the available data) and Abstracts Views on Vision4Press platform.
Data correspond to usage on the plateform after 2015. The current usage metrics is available 48-96 hours after online publication and is updated daily on week days.
Initial download of the metrics may take a while.