Fig. 1.
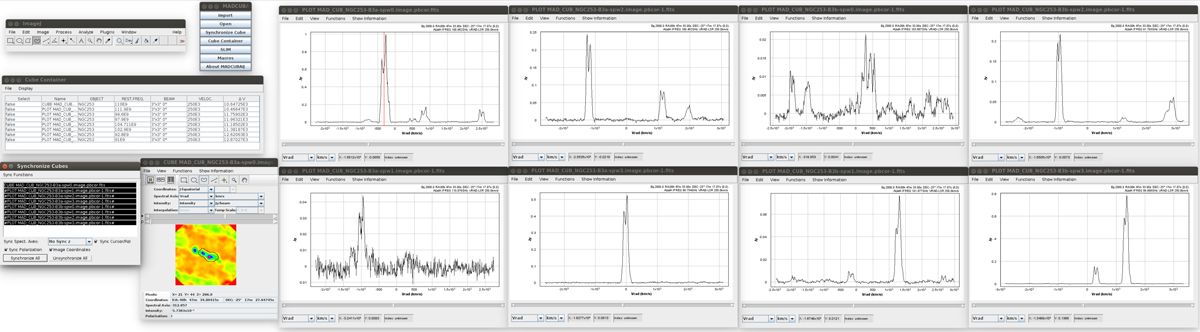
Screenshot showing the use of MADCUBA to spatially synchronise multiple datacubes. In this case, eight ALMA datacubes taken from the data published by Martín et al. (2019) are loaded and synchronised. From top to bottom and left to right, the windows shown are: the main ImageJ window; the main MADCUBA menu; the cube container window displaying the currently opened data cubes; the synchronise cube window listing the data cubes currently synchronised (in this case all opened ones); the cube display where the selected channel of the first opened data cube is displayed and the RoI is interactively defined (black contour on image); and finally the eight spectra corresponding to the integrated spectra from the RoI for each synchronised datacube. We note that the image channel displayed is selected with a red line in the top left spectrum, which corresponds to the spectrum from the cube displayed.
Current usage metrics show cumulative count of Article Views (full-text article views including HTML views, PDF and ePub downloads, according to the available data) and Abstracts Views on Vision4Press platform.
Data correspond to usage on the plateform after 2015. The current usage metrics is available 48-96 hours after online publication and is updated daily on week days.
Initial download of the metrics may take a while.