| Issue |
A&A
Volume 631, November 2019
|
|
|---|---|---|
| Article Number | A110 | |
| Number of page(s) | 6 | |
| Section | Interstellar and circumstellar matter | |
| DOI | https://doi.org/10.1051/0004-6361/201936063 | |
| Published online | 01 November 2019 | |
Using CO line ratios to trace compressed areas in bubble N131★
1
National Astronomical Observatories, Chinese Academy of Sciences,
100101 Beijing,
PR China
e-mail: This email address is being protected from spambots. You need JavaScript enabled to view it.
2
Max-Planck-Institut für Astronomie,
Königstuhl 17,
69117 Heidelberg, Germany
3
South-Western Institute for Astronomy Research, Yunnan University,
Kunming,
650500 Yunnan, PR China
e-mail: This email address is being protected from spambots. You need JavaScript enabled to view it.
4
University of Chinese Academy of Sciences,
100049 Beijing,
PR China
5
CAS Key Laboratory of FAST, National Astronomical Observatories, Chinese Academy of Sciences,
100101 Beijing, PR China
Received:
11
June
2019
Accepted:
12
October
2019
Abstract
Aims. N131 is a typical infrared dust bubble showing an expanding ring-like shell. We study the CO line ratios that can be used to trace the interaction in the expanding bubble.
Methods. We carried out new CO (3–2) observations toward bubble N131 using the 15 m JCMT, and derived line ratios by combining these observations with our previous CO (2–1) and CO (1–0) data from IRAM 30 m observations. To trace the interaction between the molecular gas and the ionized gas in the HII region, we used RADEX to model the dependence of the CO line ratios on kinetic temperature and H2 volume density, and examined the abnormal line ratios based on other simulations.
Results. We present CO (3–2), CO (2–1), and CO (1–0) integrated intensity maps convolved to the same angular resolution (22.5″). The three different CO transition maps show a similar morphology. The line ratios of WCO (3–2)/WCO (2–1) mostly range from 0.2 to 1.2 with a median of 0.54 ± 0.12, while the line ratios of WCO (2–1)/WCO (1–0) range from 0.5 to 1.6 with a median of 0.84 ± 0.15. The high CO line ratios WCO (3–2)/WCO (2–1) ≳ 0.8 and WCO (2–1)/WCO (1–0) ≳ 1.2 are beyond the threshold predicted by numerical simulations based on the assumed density-temperature structure for the inner rims of the ring-like shell, where the compressed areas are located in bubble N131.
Conclusions. These high CO integrated intensity ratios, such as WCO (3–2)/WCO (2–1) ≳ 0.8 and WCO (2–1)/WCO (1–0) ≳ 1.2, can be used as a tracer of gas-compressed regions with a relatively high temperature and density. This further suggests that the non-Gaussian part of the line-ratio distribution can be used to trace the interaction between the molecular gas and the hot gas in the bubble.
Key words: ISM: bubbles / infrared: ISM / stars: formation / molecular data / ISM: individual objects: N131
The reduced datacubes are also available at the CDS via anonymous ftp to cdsarc.u-strasbg.fr (130.79.128.5) or via http://cdsarc.u-strasbg.fr/viz-bin/cat/J/A+A/631/A110
© ESO 2019
1 Introduction
Infrared dust bubbles are ubiquitous interstellar objects (Churchwell et al. 2006, 2007; Simpson et al. 2012; Hou & Gao 2014; Zhang et al. 2013, 2016; Jayasinghe et al. 2019). However, the details of the bubble shell formation mechanism are still unclear (e.g., Beaumont & Williams 2010; Watson et al. 2008). N131 is a quite typical bubble, which has been observed and investigated in detail by Zhang et al. (2013, 2016). Bubble N131 has an inner minor radius of 13 pc and an inner major radius of 15 pc at a kinetic distance of ~8.6 kpc, and the center coordinates are RA(J2000) = 19h52m21s.5, Dec(J2000) = + 26°21′24″.0. A ring-like shell is visible at 8.0 and 24 μm and is associated with CO emission (see Fig. 1). Two giant elongated molecular clouds are located at opposite sides of the ring-like shell, and together, they exhibit a large velocity gradient. In addition, there is a huge cavity inside the bubble that is visible in the 5.8–500 μm emission. The column density, excitation temperature, and velocity of the CO (1–0) emission show a possibly stratified structure from the inner to outer rims of the ring-like shell. These suggest that bubble N131 has an expanding shell caused by feedback of strong stellar winds from the star formation at the center of the bubble (see also the detailed discussion in Zhang et al. 2016).
The CO (3–2), CO (2–1), and CO (1–0) transitions have different upper energy levels (Kaufman et al. 1999). The different transitions can therefore be used to trace different excitation conditions. The integrated intensity ratios, such as WCO (3–2)/WCO (2–1) and WCO (2–1)/WCO (1–0), may indicate a different temperature and density structure of the molecular cloud environments (Hasegawa et al. 1994; Wilson et al. 1997). For example, high WCO (2–1)∕WCO (1–0) ratios have been observed in the Large Magellanic Cloud (LMC) by Bolatto et al. (2000). It was proposed that self-absorbed emission and optical depth effects may be possible origins for the high line ratios (Bolatto et al. 2000, 2003). Additionally, the line ratios are also quite important for us to diagnose the evolutionary stage of the molecular clouds (e.g., Sakamoto et al. 1995; Beuther et al. 2000; Yoda et al. 2010; Polychroni et al. 2012; Nishimura et al. 2015).
In this work, we carry out new CO (3–2) observationstoward bubble N131 using the 15 m James Clerk Maxwell Telescope (JCMT). In combination with our previous CO (2–1) and CO (1–0) line observationswith the IRAM 30 m telescope, we study how the CO line ratios can be used to trace the interaction in the expanding infrared dust bubble N131. In Sect. 2 we describe the observations and data reduction. In Sect. 3 we show the observational results and the RADEX modeling. In Sect. 4 we mainly discuss the possibility of using the CO line ratios to trace the compressed inner rims of the ring-like shell around the bubble. In Sect. 5 we summarize our results.
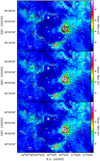 |
Fig. 1 Integrated intensity maps of CO (3–2) (top), CO (2–1) (middle), and CO (1–0) (bottom) lines with a velocity range from − 16.0 to − 5.0 km s−1 superimposed on 24 μm emission. The contour levels in each CO map start at 5σ in steps of 10σ with σCO (3–2) = 0.6 K km s−1, σCO (2– 1) = 1.3 K km s−1, and σCO (1–0) = 1.6 K km s−1. The letters and the ellipse indicate the positions of nine molecular clumps (A-I) and the ring-like shell of the bubble, respectively. The angular resolution (22.5″) is indicated in the bottom left corner of each panel. |
2 Observations
2.1 12CO J = 3−2
We carried out new CO (3–2) observations(M17BP077 and M18BP069) toward bubble N131 during September 2017–August 2018 using the Heterodyne Array Receiver Programme (HARP; Buckle et al. 2009) at the 15 m JCMT. Maps were referenced against an off-source position that was free of any significant CO emission in the Dame et al. (2001) CO Galactic Plane Survey. At 345 GHz, the half-power beam width (HPBW) was ~14.0″, and the main beam efficiency is ηmb = 0.64, taken from the JCMT efficiency archive. The main beam brightness temperature (Tmb) can be derived by 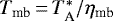 . The on-the-fly mapping mode was used to scan the bubble with a sampling step of 7.0″. For further line ratio analysis, the raw data were then convolved to the same angular resolution of 22.5″, corresponding to the lowest angular resolution ofCO (1–0) (see Sect. 2.2), with a grid of 11.0″ using the GILDAS1 software package.
Calibration scans, pointing, and focus were performed regularly. Calibration scans were taken at the beginning of each subscan. A pointing was made about every hour. A focus scan was taken every three hours, but more scans were taken around sunset and sunrise. The flux calibration is expected to be accurate to within 10%. The GILDAS software package was used to reduce the observational data.
2.2 12CO J = 2–1 and J = 1–0
Our CO (2–1) and CO (1–0) observations were simultaneously carried out in April 2014 using the IRAM 30 m telescope2 on Pico Veleta, Spain. The observations have been introduced in detail in our previous work in Zhang et al. (2016). In our raw data, the HPBWs of CO (2–1) and CO (1–0) are 11.3″ and 22.5″, respectively, with the same sampling step of 9.3″. For further line ratio analysis, the raw data were then convolved to the lowest angular resolution of 22.5″ with a grid of 11.0″ using the GILDAS software package.
3 Results and analysis
3.1 CO integrated intensity distributions
Figure 1 displays the integrated intensity maps of CO (3–2), CO (2–1), and CO (1–0) lines with a velocity range from − 16.0 to − 5.0 km s−1 superimposed on MIPSGAL 24 μm emission (Carey et al. 2009). All the CO data were convolved to the same angular resolution of 22.5″. We also label the nine selected molecular clumps (Zhang et al. 2016) and the ring-like shell of the bubble in the maps. The morphological structures of the three integrated intensity maps are clearly similar.
3.2 Spectra
We extracted several example spectra CO (3–2), CO (2–1), and CO (1–0) (see upper panels in Figs. 2 and 3) with high ratios (WCO (3–2)/WCO (2–1) ≳ 0.8 and WCO (2–1)/WCO (1–0) ≳ 1.2) from the inner rims near clumps A, B, G, and H. All the spectra with the highest ratios have high signal-to-noise ratios above 10σ. This indicates that the line ratios have high signal-to-noise ratios at least above 7σ. For comparison, we also extracted some spectra (see lower panels in Figs. 2 and 3) with low line ratios from the corresponding clump center regions.
3.3 Integrated intensity ratio distributions
Figure 4 displays the integrated intensity ratio maps of WCO (3–2)/ WCO (2–1) and WCO (2–1)/WCO (1–0). The ratios were obtained based on the integrated intensity maps that are above 5σ (see Fig. 1). For the line ratios we considered pixels above 3.5σ according tothe error propagation of the integrated intensity maps. It clearly shows that at clumps A, F, G, H, and I in the WCO (3–2)/WCO (2–1) map, the inner rims of ring-like shell have a higher integrated intensity ratio (WCO (3–2)/WCO (2–1) ≳ 0.8) than the outer rims, while in the WCO (2–1)/WCO (1–0) map the highest line ratio occurs at the inner rims of the shell near clumps A, B, E, and F with WCO (2–1)/WCO (1–0) ≳ 1.2. Figures 2 and 3 display some spectra CO (3–2), CO (2–1), and CO (1–0) extracted from the inner rims of the ring-like shell near clumps A, B, G, and H with high ratios (WCO (3–2)/WCO (2–1) ≳ 0.8 and WCO (2–1)/WCO (1–0) ≳ 1.2).
Figure 5 displays the integrated intensity ratio histograms of WCO (3–2)/WCO (2–1) and WCO (2–1)/WCO (1–0) for all pixels in Fig. 4. The line ratios of WCO (3–2)/WCO (2–1) mostly range from 0.2 to 1.2 with a median of 0.54 ± 0.12, which is slightly lower than what was found (≈0.75) at the Central Molecular Zone of the Milky Way (Kudo et al. 2011). The line ratios of WCO (2–1)/WCO (1–0) range from 0.5 to 1.6 with a median of 0.84 ± 0.15. We also derived the median value of WCO (3–2)/ WCO (1–0), which is around 0.45, close to the average value of WCO (3–2)/WCO (1–0) ≈ 0.5 in star-forming galaxies (e.g, Aravena et al. 2010, 2014; Daddi et al. 2015).
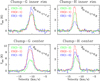 |
Fig. 2 Example spectra of the high ratios WCO (3–2)/WCO (2–1) (top) from the inner rims of the ring-like shell near clumps G and H, and of the low ratios (bottom) from the clump center regions (see also Fig. 4). |
 |
Fig. 3 Example spectra of the high ratios WCO (2–1)/WCO (1–0) (top) from the inner rims of the ring-like shell near clumps A and B, and of the low ratios (bottom) from the clump center regions (see also Fig. 4). |
3.4 RADEX modeling
To study the line ratio distributions as a function of kinetic temperature and H2 volume density in bubble N131, we used the nonlocal thermodynamic equilibrium (non-LTE) radiative transfer code RADEX3 (van der Tak et al. 2007) with the Leiden Atomic and Molecular Database (LAMDA; Schöier et al. 2005) to model the CO (3–2), CO (2–1), and CO (1–0) lines. The model grid extends over a grid of 51 temperatures (Tkin = 3–500 K) and 51 densities (nH_2 = 10–105 cm−3). The CO column density and line width were fixed with NCO = 2.2 × 1017 cm−2 and δv = 3.5 km s−1, which are the derived median values of CO column density and CO (1–0) velocity dispersion from CO (1–0) and 13CO (1–0) in N131 (see Zhang et al. 2016). The beam-filling factors were assumed to be unity.
Figures 6 and 7 display the line ratio and optical depth distributions as a function of kinetic temperature and H2 volumedensity obtained with RADEX modeling. Linear molecules of CO at low rotational transitions (critical density of about ncrit ~ 104 cm−3) are tracers of low-density gas (Kaufman et al. 1999; Qin et al. 2008; Nishimura et al. 2015; Peñaloza et al. 2018). For a given molecule, moving up to a high rotational transition will lead to a high critical density. The high rotational transitions are sensitive to a high temperature based on the large velocity gradient (LVG) model. The high temperature and density can therefore be probed with the high CO line ratios (van der Tak et al. 2007).
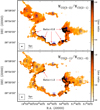 |
Fig. 4 Integrated intensity ratio maps of WCO (3–2)/WCO (2–1) (top) and WCO (2–1)/WCO (1–0) (bottom) derived from the integrated intensity maps that are above 5σ in Fig. 1. The letters indicate the positions of nine molecular clumps (A-I) in the bubble. The angular resolution isindicated in the bottom left corner of each panel. |
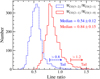 |
Fig. 5 Integrated intensity ratio histograms of WCO (3–2)/WCO (2–1) and WCO (2–1)/WCO (1–0) for all pixelsin Fig. 4. The median uncertainties are derived from the standard deviation of the sample. |
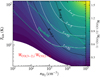 |
Fig. 6 Line ratios (R = WCO (3–2)/WCO (2–1)) and optical depths (τCO (2–1)) in the conditions of NCO = 2.2 × 1017 cm−2 and δv = 3.5 km s−1 (estimated by median values in N131) as a function of kinetic temperature and volume density by RADEX modeling. The green contour indicates a region (or threshold) for a possible gas temperature-density distribution in a colliding flow at the onset of star formation from simulations in Clark et al. (2012). |
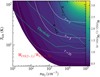 |
Fig. 7 Line ratios (R = WCO (2–1)/WCO (1–0)) and optical depths (τCO (1–0)) in the conditions of NCO = 2.2 × 1017 cm−2 and δv = 3.5 km s−1 (estimated by median values in N131) as a function of kinetic temperature and volume density by RADEX modeling. The green contour indicates a region (or threshold) for a possible gas temperature-density distribution in a colliding flow at the onset of star formation from simulations in Clark et al. (2012). |
4 Discussion: line ratios tracing the compressed areas
Wilson et al. (1997) found that the WCO (3–2)/WCO (2–1) line ratios for the molecular clouds containing optical H II regions (0.79 ± 0.05) are somewhat higher than those for the clouds without optical H II regions (0.58 ± 0.06), while the line ratio in the giant H II region is even higher (1.07 ± 0.03). Wilson et al. (1997) also suggested that the high line ratio may be caused by heating of the gas by the massive stars. Line ratio distributions such as WCO (3–2)/WCO (2–1) and WCO (2–1)/WCO (1–0) have been used to study the interaction in supernova remnant molecular cloud system (e.g., Jiang et al. 2010; Zhou et al. 2016, 2018; Arias et al. 2019). The high ratios with WCO (2–1)/WCO (1–0) ≈ 1.6 were suggested by Zhou et al. (2016) to trace the shocked compressed gas that is located at the shell of supernova remnant Tycho. Recently, Celis Peña et al. (2019) also found that the high integrated line ratios WCO (3–2)/WCO (2–1) at the shell of the LMC supergiant bubble N11 may be caused by the expansion of nebulae and the interaction with radiation from OB association. The question now is why and how the CO line ratios can be used to trace the interactions.
The infrared dust bubble N131 originates from expanding H II regions, but the H II region inside has been extinguished (Zhang et al. 2013, 2016). Figure 4 clearly shows that most parts of the inner rims of the ring-like shell have higher integrated intensity ratios (e.g., WCO (3–2)/WCO (2–1) ≳ 0.8, WCO (2–1)/WCO (1–0) ≳ 1.2) than the outer rims. Additionally, the most notable discrepancy between the two ratio distributions is that at the inner rims of the ring-like shell near clumps G and H, the ratio WCO (3–2)/WCO (2–1) is much higher than in other regions (except for the complicated clump A4) but the ratio WCO (2–1)/WCO (1–0) is not, while at the inner rims near clump B, the ratio WCO (2–1)/WCO (1–0) is much higher than in other regions but the ratio WCO (3–2)/WCO (2–1) is not. This may suggest that the inner rims of the ring-like shell near clumps G and H have a relatively high kinetic temperature up to the excitation temperature of high transition level of CO (3–2), leading to stronger CO (3–2) emission than in other regions; while the inner rims near clump B have a relatively low kinetic temperature just up to the low transition level of CO (2–1), leading to stronger CO (2–1) emission than in other regions. This also suggests that the inner rims of the ring-like shell were compressed by strong stellar winds from the bubble insides (see also discussion in Nishimura et al. 2015).
To trace the compressed inner rims of the ring-like shell by stellar winds from the bubble insides, we computed the expected CO line ratios at different gas temperatures and densities using RADEX code. The results are presented in Figs. 6 and 7. We then determined the CO line ratios that can be used to trace the interactions. We recall that in an ordinary molecular cloud, the cold gas is mainly heated by cosmic rays. This heating is balanced by radiative cooling (Draine 2011). As a result, we expect a limited range of temperatures and densities for the molecular gas, which leads to a limited range of observed line ratios. These line ratios, which lie far beyond the upper limit, could trace the interaction between the cold and hot gas that presumably lies in the inner rims of a bubble shell because these interactions should increase the temperature and density.
Therefore, we propose to use CO line ratios WCO (3–2)/ WCO (2–1) ≳ 0.8 and WCO (2–1)/WCO (1–0) ≳ 1.2 to trace the compressed inner rims of the ring-like shell. The thresholds were selected based on the following considerations. The thresholds correspond to the non-Gaussian tail of line ratio distribution presented in Fig. 5, where we propose that non-interacting clouds should produce line ratios that are Gaussian distributed, and the non-Gaussian parts of the distributions are caused by interaction. To justify our thresholds, we used RADEX to compute the line ratios as a function of gas temperature and density (see Figs. 6 and 7). By overlaying the expected range of gas density and temperature found in the most recent numerical simulations5 (Clark et al. 2012), we derived the expected CO line ratios for non-interacting clouds. The highest ratios are located in regions with moderate or low optical depths (τ ≲ 5 for WCO (3–2)/WCO (2–1) ≳ 0.8 and τ ≲ 1 for WCO (2–1)/WCO (1–0) ≳ 1.2) in the temperature-density plane. Line ratios higher than this can be used to trace the interaction region where the gas temperatureand density are higher than normal.
5 Summary
Based on our previous multiwavelength observations (Zhang et al. 2013, 2016), the infrared dust bubble N131 is a typical bubble showing an expanding ring-like shell, which has been swept up by the energetic winds of ionizing stars inside. We here carried out new CO (3–2) observations toward the bubble N131 using the 15 m JCMT, and also used our published CO (2–1) and CO (1–0) line data observed with the IRAM 30 m telescope. We plotted their integrated intensity maps, which were convolved to the same angular resolution (22.5″). We find that the three different CO transition maps show a similar morphological structure.
In bubble N131, we used the RADEX code to model the kinetic temperature and H2 volume density, and we studied the relationship between them and line ratios. The line ratios of WCO (3–2)/WCO (2–1) mostly range from 0.2 to 1.2 with a median of 0.54 ± 0.12, while the line ratios of WCO (2–1)/WCO (1–0) range from 0.5 to 1.6 with a median of 0.84 ± 0.15. The line width ratios between CO (3–2), CO (2–1), and CO (1–0) are close to unity.
To probe the interaction between the hot stellar winds and the cold molecular ring-like shell, we performed RADEX modeling to test the dependence of the line ratios on the underlying parameters such as temperature and density, and to predict the range of CO integrated intensity ratios WCO (3–2)/WCO (2–1) and WCO (2–1)/WCO (1–0) if the gas temperatures and densities are predicted by the chemodynamics simulations. Line ratios far beyond the temperature-density threshold (Clark et al. 2012) could thus be used to trace the interactions.
From our observations, we find that the high CO integrated intensity ratios WCO (3–2)/WCO (2–1) and WCO (2–1)/WCO (1–0) are far beyond the prediction from the most recent numerical simulation without stellar feedback. As a result, these high line ratios can be used to trace the compressed areas in bubble N131. We suggest that the high CO integrated intensity ratios, such as WCO (3–2)/WCO (2–1) ≳ 0.8 and WCO (2–1)/WCO (1–0) ≳ 1.2, can be used as a tracer of gas-compressed regions with a relatively high temperature and density. We further proved that the non-Gaussian part of the line-ratio distribution can be used to trace the interaction between the molecular gas and the hot gas in the bubble.
Acknowledgements
We thank the anonymous referees for constructive comments that improved the manuscript. This work is supported by the National Natural Science Foundation of China Nos. 11703040, 11743007, U1531246, and National Key Basic Research Program of China (973 Program) No. 2015CB857101. C.-P.Z. acknowledges support by the MPG-CAS Joint Doctoral Promotion Program (DPP) and China Scholarship Council (CSC) in Germany as a postdoctoral researcher. The JCMT is operated by the EAO on behalf of NAOJ; ASIAA; KASI; CAMS as well as the National Key R&D Program of China (No. 2017YFA0402700). Additional funding support is provided by the STFC and participating universities in the UK and Canada.
Appendix A: Line width ratio
Figure A.1 displays the line width ratio maps of δvCO (3–2)/ δvCO (2–1) and δvCO (2–1)/δvCO (1–0). For clumpsF, G, and H in the δvCO (3–2)/δvCO (2–1) map, the outer rims of the ring-like shell have a higher line width ratio than the inner rims, while this is reversed for clump I. For the other clumps, there is no visible line ratio gradient feature. In the δvCO (2–1)/δvCO (1–0) map, it seems that the higher line width ratios are located at the clump center positions, and the line ratio gradient is not evident. Figure A.2 displays the line width ratio histograms of δvCO (3–2)/δvCO (2–1) and δvCO (2–1)/δvCO (1–0) for all pixels in Fig. A.1. The line ratios of δvCO (3–2)/δvCO (2–1) mostly range from 0.6 to 1.8 with a median of 1.06 ± 0.18, while δvCO (2–1)/δvCO (1–0) range from 0.5 to 1.3 with a median of 0.86 ± 0.18. We can also derive that the median value of δvCO (3–2)/δvCO (1–0) is around 0.91. Compared with the line width ratios, we have δvCO (1–0) > δvCO (3–2) > δvCO (2–1) only for their median values. However, generally, the line width ratios between CO (3–2), CO (2–1), and CO (1–0) are close to unity.
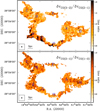 |
Fig. A.1 Line width ratio maps of δvCO (3–2)/δvCO (2–1) (top) and δvCO (2–1)/δvCO (1–0) (bottom). The letters indicate the positions of the nine molecular clumps (A-I) in the bubble. The angular resolution is indicated in the bottom left corner. |
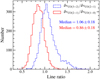 |
Fig. A.2 Line width ratio histograms of δvCO (3–2)/δvCO (2–1) and δvCO (2–1)/δvCO (1–0) for all pixelsin Fig. A.1. |
References
- Aravena, M., Carilli, C., Daddi, E., et al. 2010, ApJ, 718, 177 [NASA ADS] [CrossRef] [Google Scholar]
- Aravena, M., Hodge, J. A., Wagg, J., et al. 2014, MNRAS, 442, 558 [NASA ADS] [CrossRef] [Google Scholar]
- Arias, M., Domček, V., Zhou, P., & Vink, J. 2019, A&A, 627, A75 [CrossRef] [EDP Sciences] [Google Scholar]
- Beaumont, C. N., & Williams, J. P. 2010, ApJ, 709, 791 [NASA ADS] [CrossRef] [Google Scholar]
- Beuther, H., Kramer, C., Deiss, B., & Stutzki, J. 2000, A&A, 362, 1109 [Google Scholar]
- Bolatto, A. D., Jackson, J. M., Israel, F. P., Zhang, X., & Kim, S. 2000, ApJ, 545, 234 [NASA ADS] [CrossRef] [Google Scholar]
- Bolatto, A. D., Leroy, A., Israel, F. P., & Jackson, J. M. 2003, ApJ, 595, 167 [NASA ADS] [CrossRef] [Google Scholar]
- Buckle, J. V., Hills, R. E., Smith, H., et al. 2009, MNRAS, 399, 1026 [NASA ADS] [CrossRef] [Google Scholar]
- Carey, S. J., Noriega-Crespo, A., Mizuno, D. R., et al. 2009, PASP, 121, 76 [NASA ADS] [CrossRef] [Google Scholar]
- Celis Peña, M., Paron, S., Rubio, M., Herrera, C. N., & Ortega, M. E. 2019, A&A, 628, A96 [CrossRef] [EDP Sciences] [Google Scholar]
- Churchwell, E., Povich, M. S., Allen, D., et al. 2006, ApJ, 649, 759 [NASA ADS] [CrossRef] [Google Scholar]
- Churchwell, E., Watson, D. F., Povich, M. S., et al. 2007, ApJ, 670, 428 [NASA ADS] [CrossRef] [Google Scholar]
- Clark, P. C., Glover, S. C. O., Klessen, R. S., & Bonnell, I. A. 2012, MNRAS, 424, 2599 [NASA ADS] [CrossRef] [Google Scholar]
- Daddi, E., Dannerbauer, H., Liu, D., et al. 2015, A&A, 577, A46 [NASA ADS] [CrossRef] [EDP Sciences] [Google Scholar]
- Dame, T. M., Hartmann, D., & Thaddeus, P. 2001, ApJ, 547, 792 [NASA ADS] [CrossRef] [Google Scholar]
- Draine, B. T. 2011, Physics of the Interstellar and Intergalactic Medium (Princeton: Princeton University Press) [Google Scholar]
- Hasegawa, T. I., Mitchell, G. F., Matthews, H. E., & Tacconi, L. 1994, ApJ, 426, 215 [NASA ADS] [CrossRef] [Google Scholar]
- Hou, L. G., & Gao, X. Y. 2014, MNRAS, 438, 426 [NASA ADS] [CrossRef] [Google Scholar]
- Jayasinghe, T., Dixon, D., Povich, M. S., et al. 2019, MNRAS, 488, 1141 [CrossRef] [Google Scholar]
- Jiang, B., Chen, Y., Wang, J., et al. 2010, ApJ, 712, 1147 [NASA ADS] [CrossRef] [Google Scholar]
- Kaufman, M. J., Wolfire, M. G., Hollenbach, D. J., & Luhman, M. L. 1999, ApJ, 527, 795 [NASA ADS] [CrossRef] [Google Scholar]
- Kudo, N., Torii, K., Machida, M., et al. 2011, PASJ, 63, 171 [NASA ADS] [CrossRef] [Google Scholar]
- Nishimura, A., Tokuda, K., Kimura, K., et al. 2015, ApJS, 216, 18 [NASA ADS] [CrossRef] [EDP Sciences] [Google Scholar]
- Peñaloza, C. H., Clark, P. C., Glover, S. C. O., & Klessen, R. S. 2018, MNRAS, 475, 1508 [NASA ADS] [CrossRef] [Google Scholar]
- Polychroni, D., Moore, T. J. T., & Allsopp, J. 2012, MNRAS, 422, 2992 [NASA ADS] [CrossRef] [Google Scholar]
- Qin, S.-L., Wang, J.-J., Zhao, G., Miller, M., & Zhao, J.-H. 2008, A&A, 484, 361 [NASA ADS] [CrossRef] [EDP Sciences] [Google Scholar]
- Sakamoto, S., Hasegawa, T., Hayashi, M., Handa, T., & Oka, T. 1995, ApJS, 100, 125 [NASA ADS] [CrossRef] [Google Scholar]
- Schöier, F. L., van der Tak, F. F. S., van Dishoeck, E. F., & Black, J. H. 2005, A&A, 432, 369 [NASA ADS] [CrossRef] [EDP Sciences] [Google Scholar]
- Simpson, R. J., Povich, M. S., Kendrew, S., et al. 2012, MNRAS, 424, 2442 [NASA ADS] [CrossRef] [Google Scholar]
- van der Tak, F. F. S., Black, J. H., Schöier, F. L., Jansen, D. J., & van Dishoeck, E. F. 2007, A&A, 468, 627 [NASA ADS] [CrossRef] [EDP Sciences] [Google Scholar]
- Watson, C., Povich, M. S., Churchwell, E. B., et al. 2008, ApJ, 681, 1341 [NASA ADS] [CrossRef] [Google Scholar]
- Wilson, C. D., Walker, C. E., & Thornley, M. D. 1997, ApJ, 483, 210 [NASA ADS] [CrossRef] [Google Scholar]
- Yoda, T., Handa, T., Kohno, K., et al. 2010, PASJ, 62, 1277 [NASA ADS] [Google Scholar]
- Zhang, C.-P., Wang, J.-J., & Xu, J.-L. 2013, A&A, 550, A117 [NASA ADS] [CrossRef] [EDP Sciences] [Google Scholar]
- Zhang, C.-P., Li, G.-X., Wyrowski, F., et al. 2016, A&A, 585, A117 [NASA ADS] [CrossRef] [EDP Sciences] [Google Scholar]
- Zhou, P., Chen, Y., Zhang, Z.-Y., et al. 2016, ApJ, 826, 34 [NASA ADS] [CrossRef] [Google Scholar]
- Zhou, P., Li, J.-T., Zhang, Z.-Y., et al. 2018, ApJ, 865, 6 [CrossRef] [Google Scholar]
Based on observations carried out with the IRAM 30 m Telescope. IRAM is supported by INSU/CNRS (France), MPG (Germany), and IGN (Spain).
Clump A is a small expanding H II region that is deeply embedded in the ring-like shell of bubble N131 (see details in Zhang et al. 2016).
Although the simulations in Clark et al. (2012) were carried out under a certain set of initial conditions, the predicted temperature-density relation for the molecular gas is relatively robust (e.g., independent of the initial condition) and is applicable to our data. Additionally, due to the short cooling times, the density-temperature relation of the molecular gas should not depend on the initial conditions (e.g., whether the converging speed is fast or slow).
All Figures
|
Fig. 1 Integrated intensity maps of CO (3–2) (top), CO (2–1) (middle), and CO (1–0) (bottom) lines with a velocity range from − 16.0 to − 5.0 km s−1 superimposed on 24 μm emission. The contour levels in each CO map start at 5σ in steps of 10σ with σCO (3–2) = 0.6 K km s−1, σCO (2– 1) = 1.3 K km s−1, and σCO (1–0) = 1.6 K km s−1. The letters and the ellipse indicate the positions of nine molecular clumps (A-I) and the ring-like shell of the bubble, respectively. The angular resolution (22.5″) is indicated in the bottom left corner of each panel. |
| In the text | |
|
Fig. 2 Example spectra of the high ratios WCO (3–2)/WCO (2–1) (top) from the inner rims of the ring-like shell near clumps G and H, and of the low ratios (bottom) from the clump center regions (see also Fig. 4). |
| In the text | |
|
Fig. 3 Example spectra of the high ratios WCO (2–1)/WCO (1–0) (top) from the inner rims of the ring-like shell near clumps A and B, and of the low ratios (bottom) from the clump center regions (see also Fig. 4). |
| In the text | |
|
Fig. 4 Integrated intensity ratio maps of WCO (3–2)/WCO (2–1) (top) and WCO (2–1)/WCO (1–0) (bottom) derived from the integrated intensity maps that are above 5σ in Fig. 1. The letters indicate the positions of nine molecular clumps (A-I) in the bubble. The angular resolution isindicated in the bottom left corner of each panel. |
| In the text | |
|
Fig. 5 Integrated intensity ratio histograms of WCO (3–2)/WCO (2–1) and WCO (2–1)/WCO (1–0) for all pixelsin Fig. 4. The median uncertainties are derived from the standard deviation of the sample. |
| In the text | |
|
Fig. 6 Line ratios (R = WCO (3–2)/WCO (2–1)) and optical depths (τCO (2–1)) in the conditions of NCO = 2.2 × 1017 cm−2 and δv = 3.5 km s−1 (estimated by median values in N131) as a function of kinetic temperature and volume density by RADEX modeling. The green contour indicates a region (or threshold) for a possible gas temperature-density distribution in a colliding flow at the onset of star formation from simulations in Clark et al. (2012). |
| In the text | |
|
Fig. 7 Line ratios (R = WCO (2–1)/WCO (1–0)) and optical depths (τCO (1–0)) in the conditions of NCO = 2.2 × 1017 cm−2 and δv = 3.5 km s−1 (estimated by median values in N131) as a function of kinetic temperature and volume density by RADEX modeling. The green contour indicates a region (or threshold) for a possible gas temperature-density distribution in a colliding flow at the onset of star formation from simulations in Clark et al. (2012). |
| In the text | |
|
Fig. A.1 Line width ratio maps of δvCO (3–2)/δvCO (2–1) (top) and δvCO (2–1)/δvCO (1–0) (bottom). The letters indicate the positions of the nine molecular clumps (A-I) in the bubble. The angular resolution is indicated in the bottom left corner. |
| In the text | |
|
Fig. A.2 Line width ratio histograms of δvCO (3–2)/δvCO (2–1) and δvCO (2–1)/δvCO (1–0) for all pixelsin Fig. A.1. |
| In the text | |
Current usage metrics show cumulative count of Article Views (full-text article views including HTML views, PDF and ePub downloads, according to the available data) and Abstracts Views on Vision4Press platform.
Data correspond to usage on the plateform after 2015. The current usage metrics is available 48-96 hours after online publication and is updated daily on week days.
Initial download of the metrics may take a while.