Fig. 6
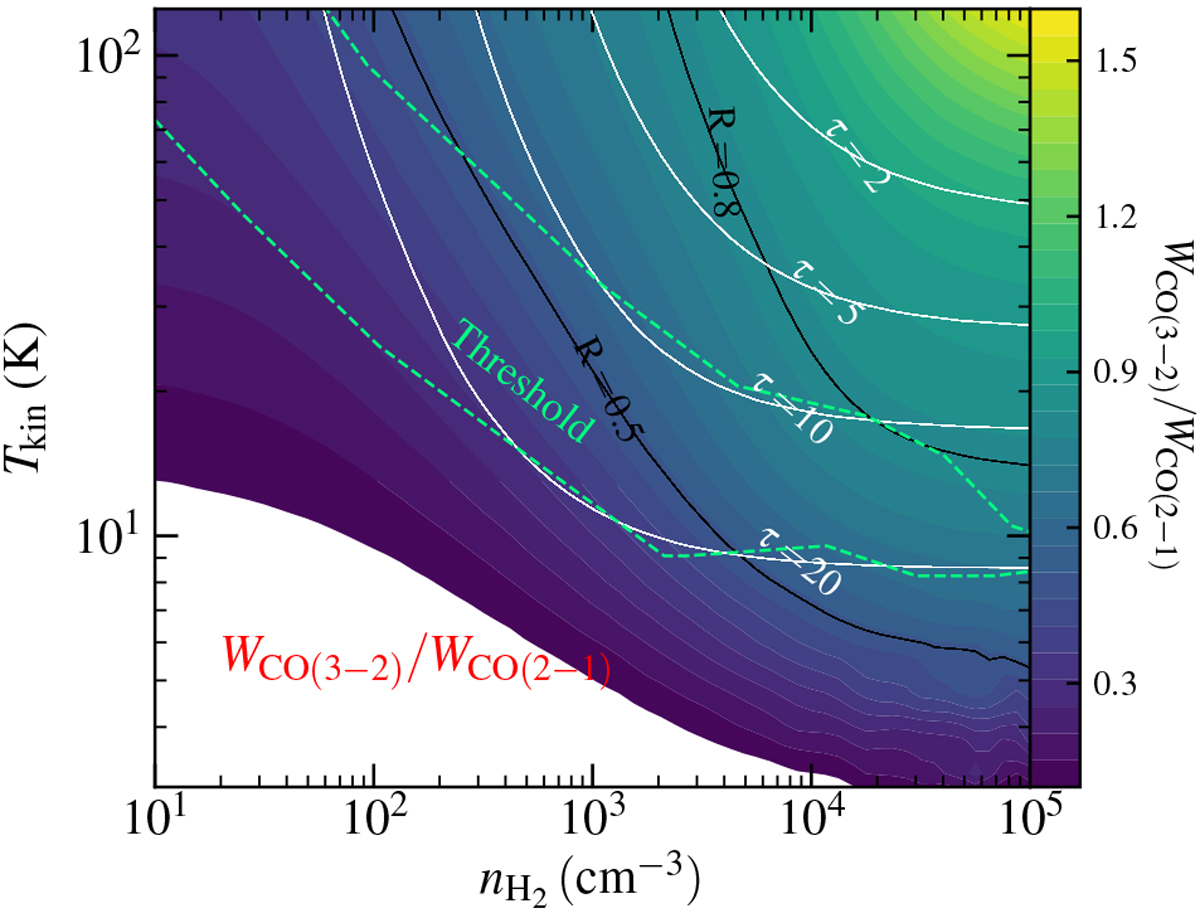
Line ratios (R = WCO (3–2)/WCO (2–1)) and optical depths (τCO (2–1)) in the conditions of NCO = 2.2 × 1017 cm−2 and δv = 3.5 km s−1 (estimated by median values in N131) as a function of kinetic temperature and volume density by RADEX modeling. The green contour indicates a region (or threshold) for a possible gas temperature-density distribution in a colliding flow at the onset of star formation from simulations in Clark et al. (2012).
Current usage metrics show cumulative count of Article Views (full-text article views including HTML views, PDF and ePub downloads, according to the available data) and Abstracts Views on Vision4Press platform.
Data correspond to usage on the plateform after 2015. The current usage metrics is available 48-96 hours after online publication and is updated daily on week days.
Initial download of the metrics may take a while.