Free Access
Fig. 6
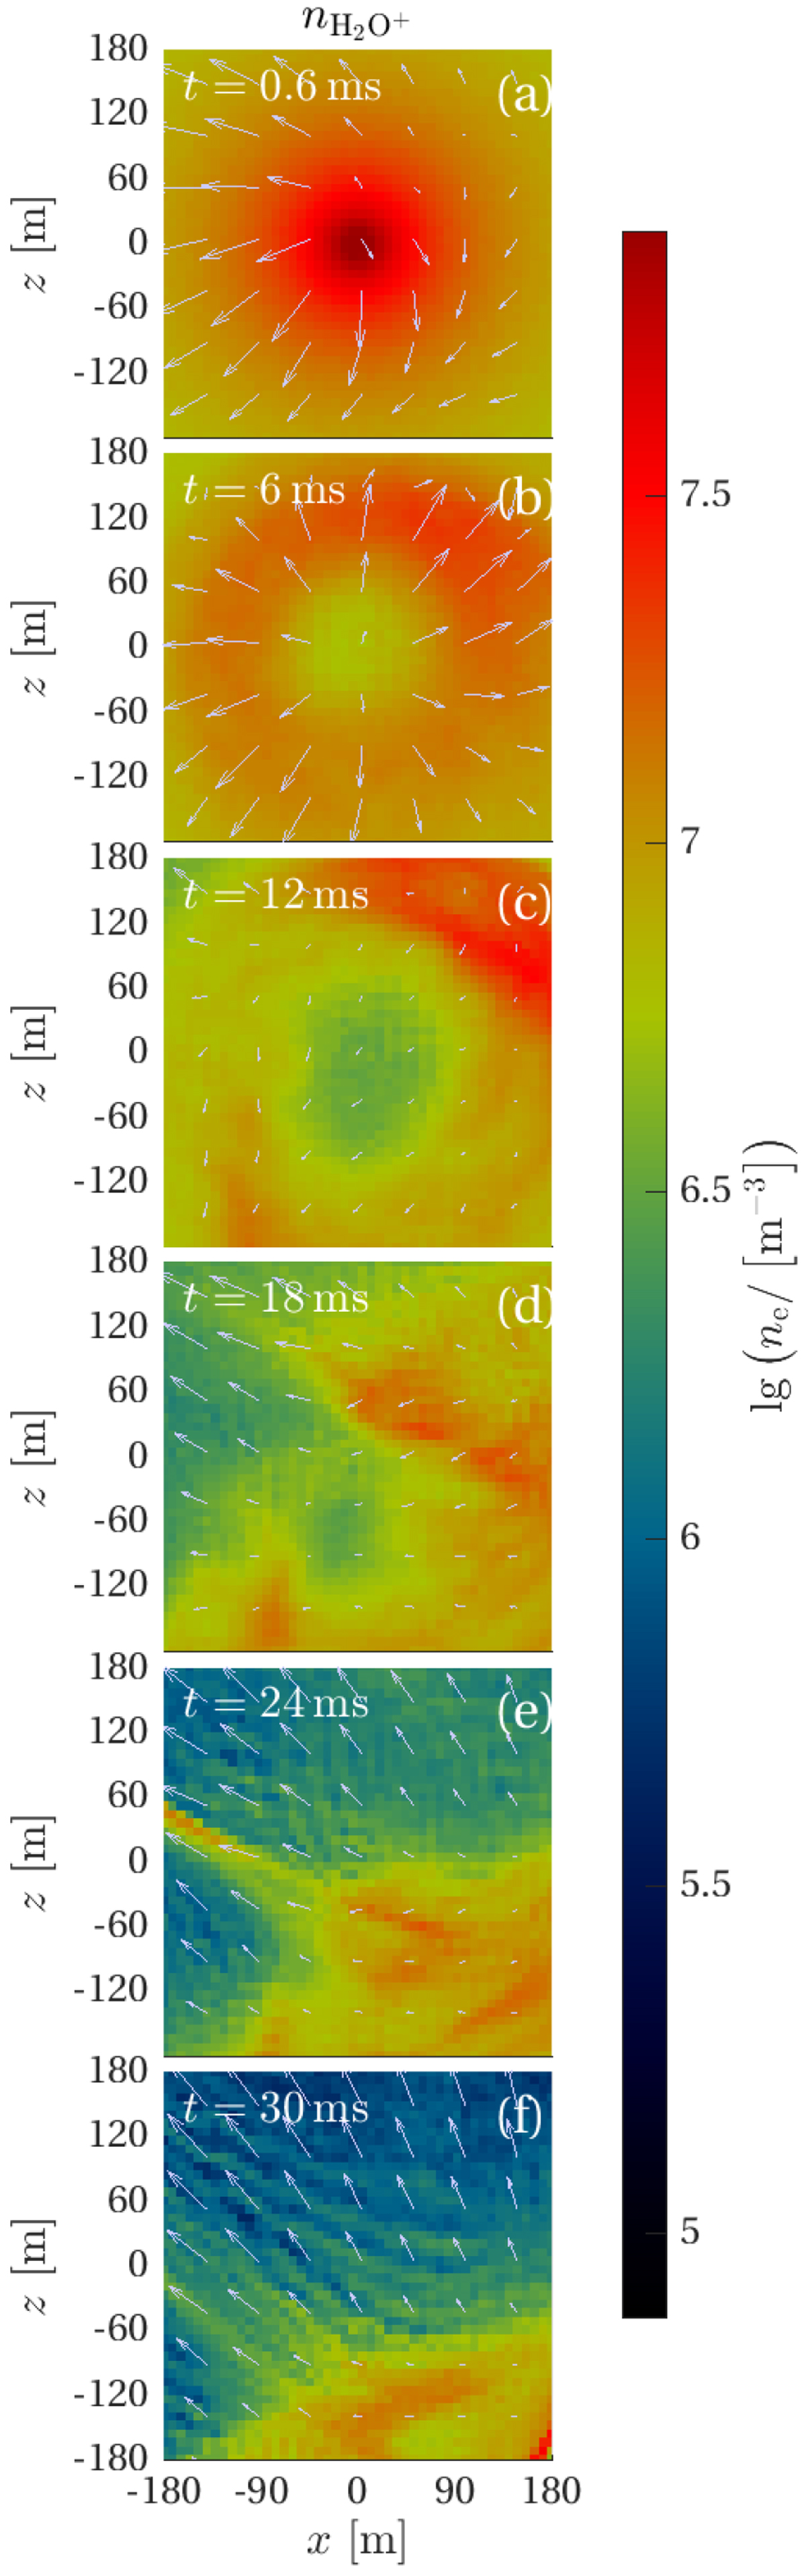
Waterion density in the x–z plane for times t = 0.6, 6, 12, 18, 24, and 30 ms. The colour-coded quantity is the logarithm of the density, and the arrows indicate the water ion velocity. Each row shows a different instance in time, as indicated in each panel.
Current usage metrics show cumulative count of Article Views (full-text article views including HTML views, PDF and ePub downloads, according to the available data) and Abstracts Views on Vision4Press platform.
Data correspond to usage on the plateform after 2015. The current usage metrics is available 48-96 hours after online publication and is updated daily on week days.
Initial download of the metrics may take a while.