Fig. 4
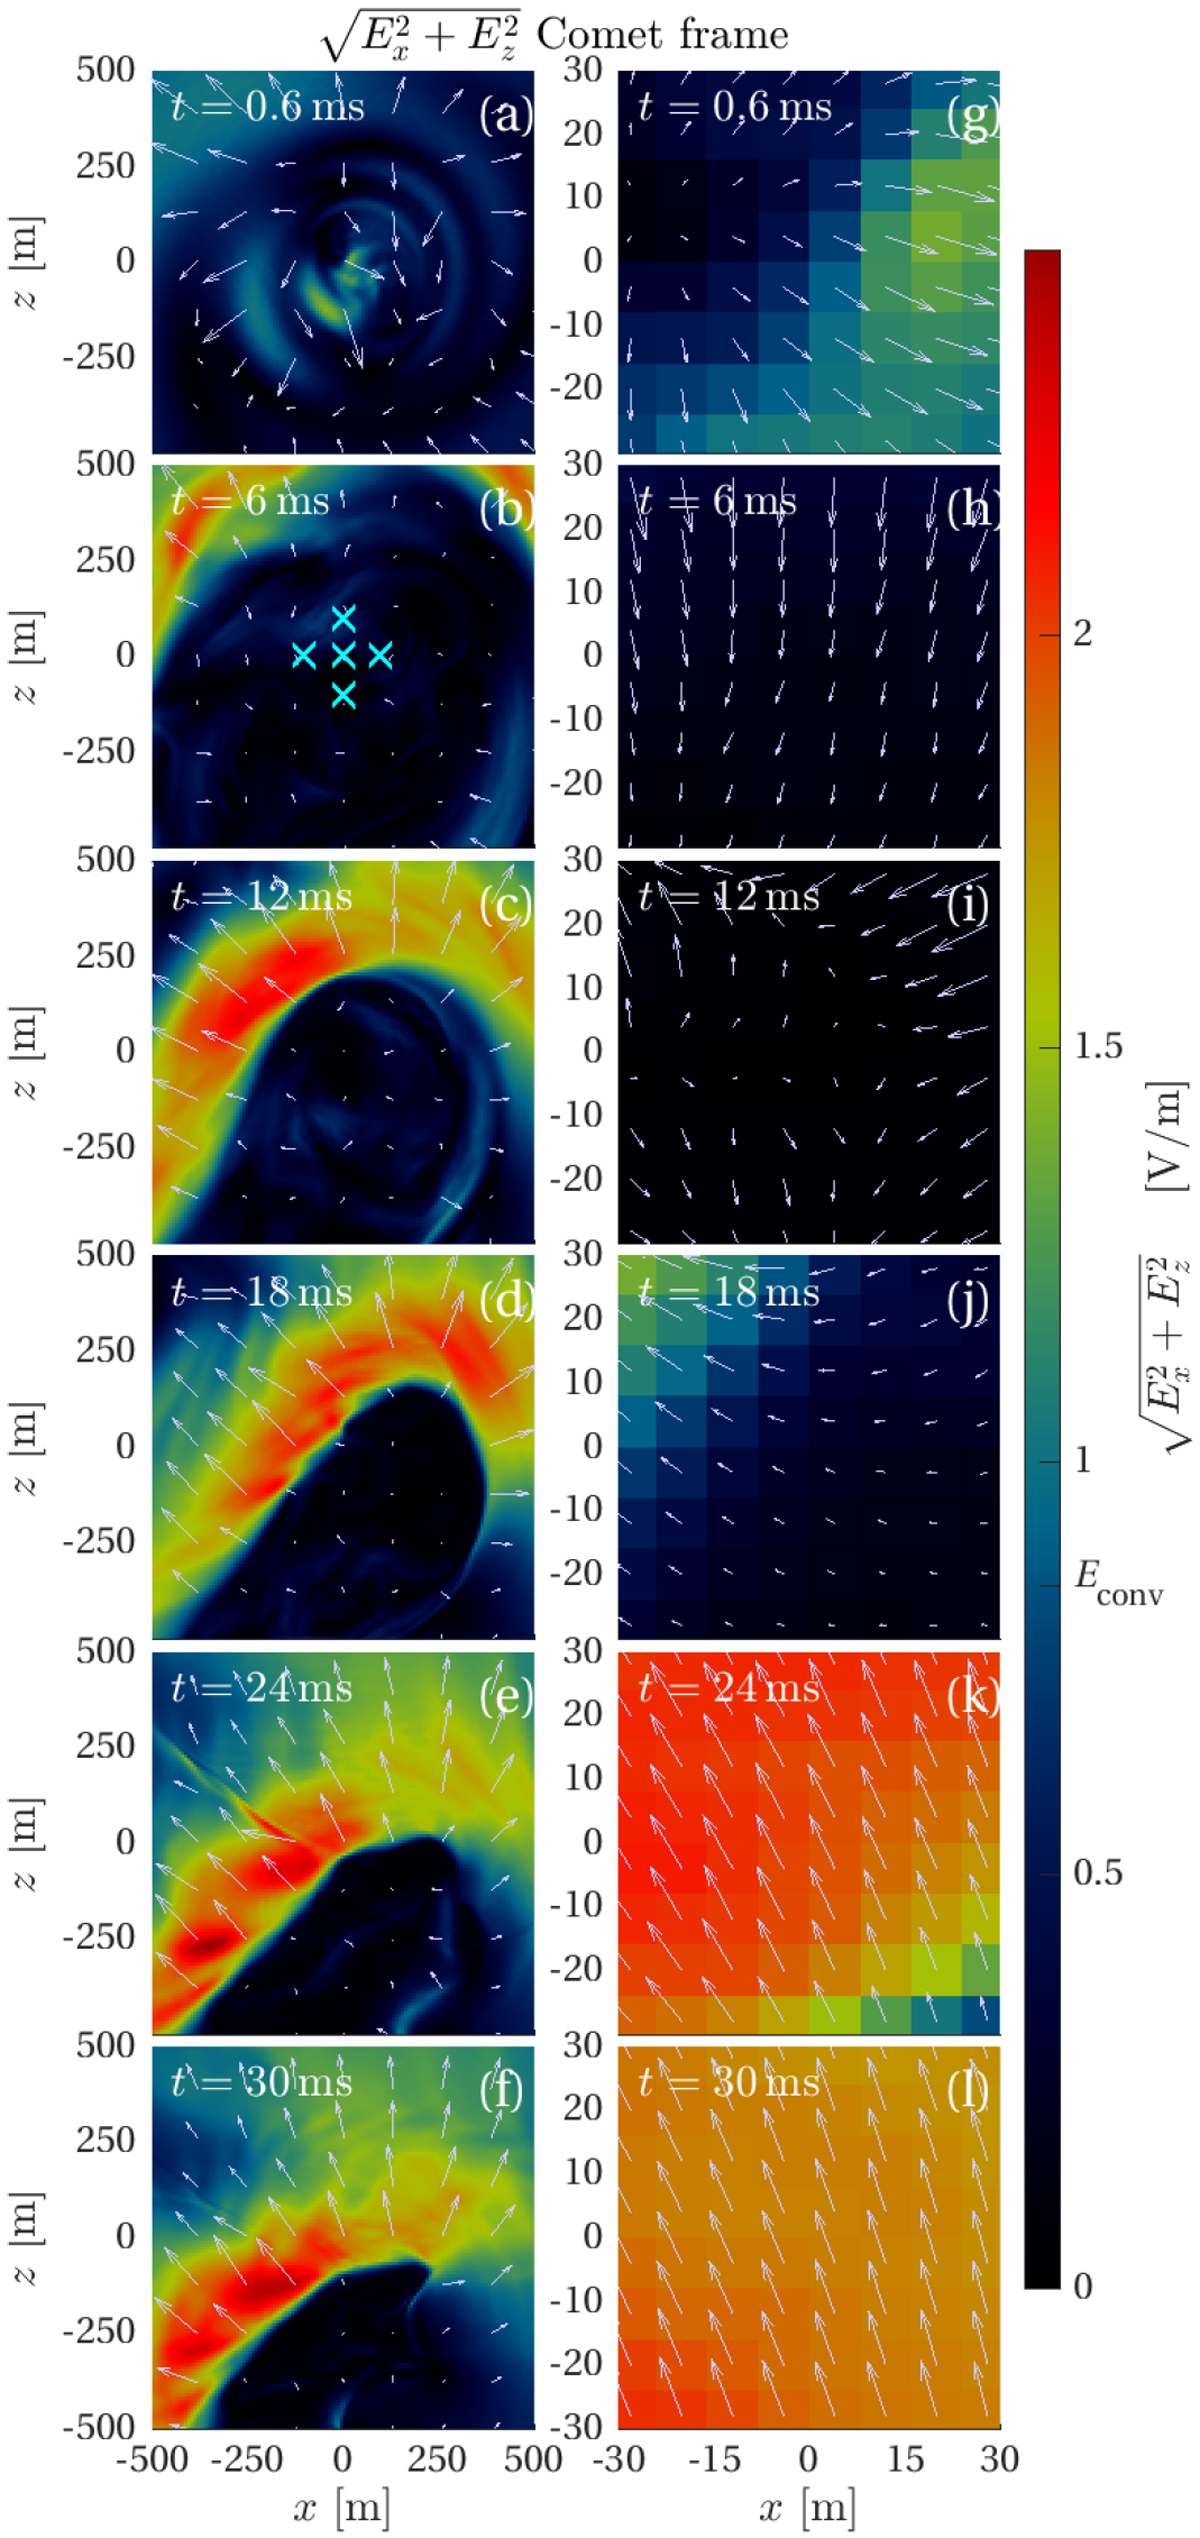
Electric field in the x–z plane for times t = 0.6, 6, 12, 18, 24, and 30 ms. The right column shows a zoomed-in view of the panels in the left column. Each row shows a different instance in time as indicated in each panel. The positions of the probes (cf. Fig. 3) in the x–z plane are indicated in panel b. The sun is to the right, and the magnitude of the convective electric field Econv = 0.85 Vm−1 is indicated on the colour scale. All electric fields are shown in the comet frame of reference.
Current usage metrics show cumulative count of Article Views (full-text article views including HTML views, PDF and ePub downloads, according to the available data) and Abstracts Views on Vision4Press platform.
Data correspond to usage on the plateform after 2015. The current usage metrics is available 48-96 hours after online publication and is updated daily on week days.
Initial download of the metrics may take a while.