Fig. 5.
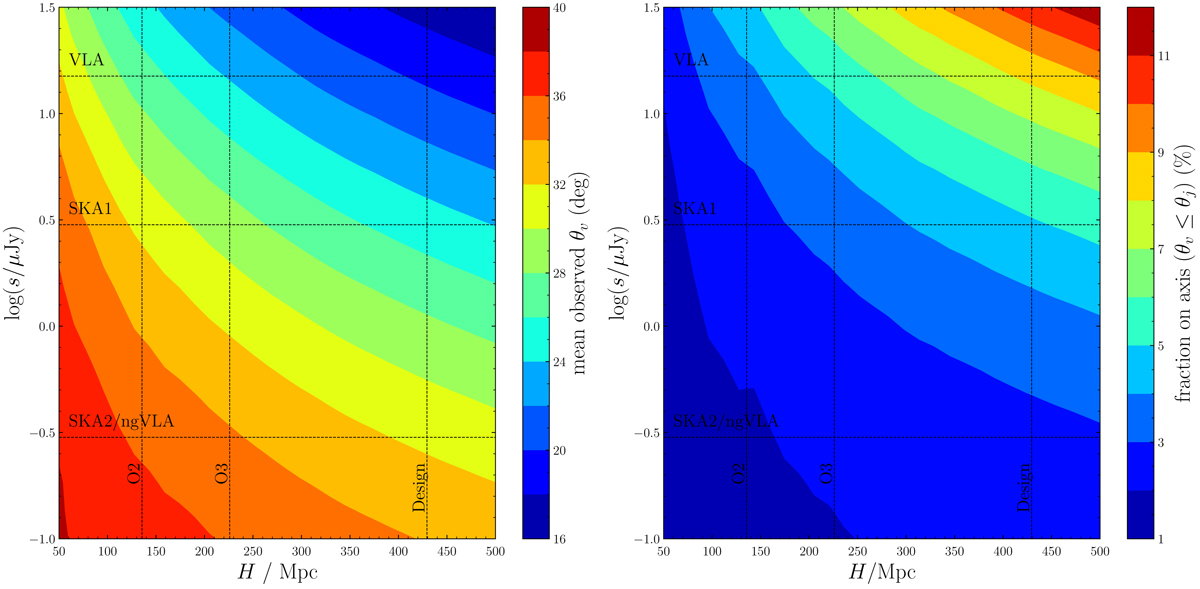
Left: mean viewing angle of jointly detected events, as function of horizon and radio sensitivity s. Values of H for O2, O3 and design instruments, as well as s for VLA, SKA1 and SKA2/ngVLA, are indicated as dashed lines. Right: fraction of on-axis events (defined by θv ≤ θj) among jointly detected events in same H–s diagram.
Current usage metrics show cumulative count of Article Views (full-text article views including HTML views, PDF and ePub downloads, according to the available data) and Abstracts Views on Vision4Press platform.
Data correspond to usage on the plateform after 2015. The current usage metrics is available 48-96 hours after online publication and is updated daily on week days.
Initial download of the metrics may take a while.