Fig. 3.
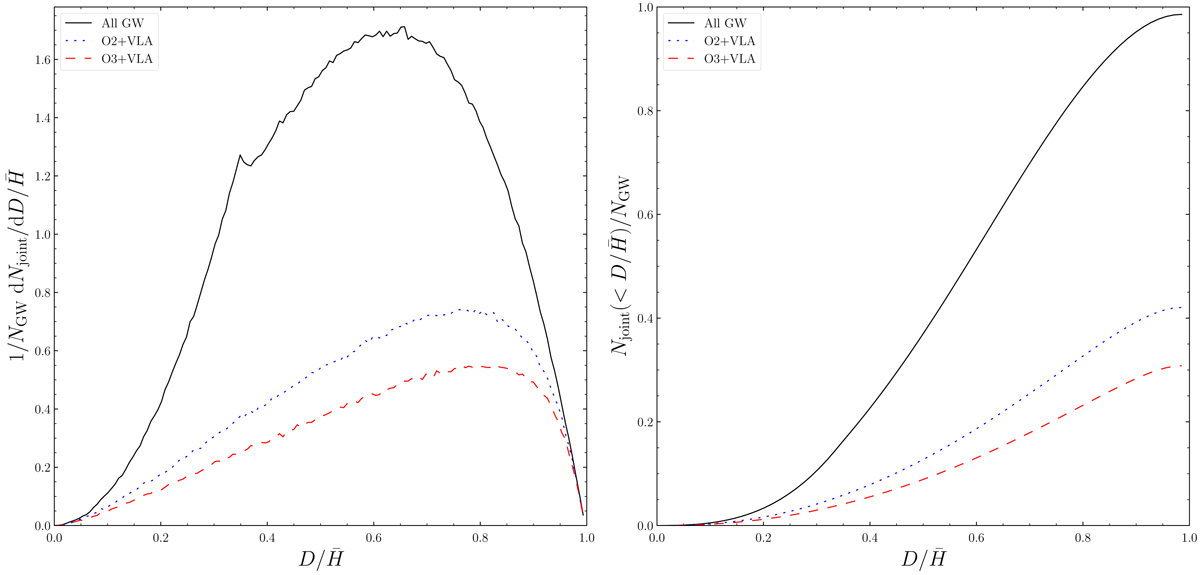
Left: differential distribution of distances (normalized to the sky-position-averaged horizon) of events in total GW population (full line), and detectable jointly in O2-VLA (dotted line) and O3-VLA (dashed line) configurations. Right: cumulative distribution of same events. Distributions have been normalized to the fraction of jointly detected events among all GW-detected events, see text for details.
Current usage metrics show cumulative count of Article Views (full-text article views including HTML views, PDF and ePub downloads, according to the available data) and Abstracts Views on Vision4Press platform.
Data correspond to usage on the plateform after 2015. The current usage metrics is available 48-96 hours after online publication and is updated daily on week days.
Initial download of the metrics may take a while.